Global Talent Mobility and Governance Report ——Analysis with the United States as a Hub(2024)
2024
Global Talent Mobility and Governance Report
——Analysis with the United States as a Hub
Center for China and Globalization (CCG)
Alliance of Global Talent Organization (AGTO)
Yingzhong Overseas Consulting
2024.06
“As the world embarks on a journey towards post-pandemic recovery and economic resurgence, the 2024 Global Talent Mobility and Governance Report serves as an invaluable compass, illuminating the pivotal role of talent exchange in advancing global prosperity, with the United States and China positioned as key players. By fostering a deeper understanding of international talent flows and governance mechanisms, this report not only empowers decision-makers but also underscores the imperative of fostering mutual understanding and collaborative efforts between nations, exemplifying the spirit of partnership essential for the shared advancement of humanity.”
-Ambassador Max Baucus
Contents
Report Overview
I. The Global Landscape of Talent Mobility
(I) International Talent Mobility has entered a New Paradigm?
(II) The Current Status of International Migration Flow?
(III) Current State of Global International Student Mobility
II. Characteristics of International Talent Mobility with the United States as a Hub
(I). Characteristics of Talent Mobility from China to the United States
(II) Characteristics of Talent Mobility from European Countries to the United States
(III) Characteristics of Talent Mobility from India to the United States
(IV)Summary of Characteristics of International Talent Mobility with the United States as a Hub
III. Trend of American Policies on Governance on the Flow of International Talents
(I)Attach long-term and great importance to the cultivation and introduction of talents in STEM disciplines upon cooperation among several authorities
(II) Continuously expand the STEM discipline fields and the introduction of international talents
(III) Reform the visa policy and lower the threshold for STEM talents to go to and stay in the United States
(IV)Actively promote communication and cooperation among international talents in STEM fields
IV. Overview of China’s international mobility of talent and governance recommendations
(I)The Overview of International Talent Mobility in China
(II) Recommendations related to optimizing the governance of China’s international mobility of talent
References
About Alliance of Global Talent Organization(AGTO)
About Center for China and Globalization(CCG)
About Yingzhong Overseas Consulting
Research Team Advisor
Research Team
Report Overview
Talent is the key engine of global development, driving countries around the world to advance together, and the international exchange and flow of talent is an indispensable driving force to promote this process. In the post-pandemic period, as the global economy gradually returns to the track of growth, the competition for talents among countries has become increasingly fierce. This report is committed to in-depth analysis of the trend changes of talent mobility in the new stage of globalization, aiming to facilitate the understanding and awareness of all sectors of society on the issue of international talent mobility through timely and detailed data analysis and in-depth professional research, promoting the construction of a more open, inclusive and efficient new ecology of talent mobility and governance. The main contents of this report include the global landscape of talent mobility, the characteristics of international talent flow with the United States as the hub, the governance system and policy trends of international talent flow in the United States, and the status quo and governance suggestions of China’s international talent flow. The report will focus on analyzing the current situation of international talent flow respectively from China, Europe, India to the United States, as well as the latest dynamics of the United States’ international talent flow governance as an international talent flow hub and an international talent highland, and put forward strategic suggestions for optimizing international talent mobility governance in China based on the experience of the United States in international talent flow governance.
Summary of Findings:
First, the US remains the world’s premier destination for international talent, and its attraction to top talent and international students remains strong. In 2019, the total number of nonimmigrant work visas and occupational immigrant visas issued by the U.S. to citizens from China, Europe, and India will be approximately 710,000; in 2023, the figure will be 790,000, an increase of 11.5% from 2019, the year before the epidemic. Of these, the number of Chinese citizens receiving the above visas recovered to 64% of 2019, while in Europe it recovered to 87%, with India showing strong growth to 1.5 times its 2019 level. In the same year, the total number of students from China, India, the United Kingdom, France, and Germany, studying in US higher education institutions was 587,000, recovering to 98.9% in 2019.
Second, after the COVID-19 Pandemic, the number of Indian citizens obtaining US work visas, green cards and studying in the US has increased rapidly, and India has become the largest source of international talents for the US. In 2023, the total number of Indian nationals granted US non-immigrant work visas and occupational immigrant visas soared to 489,000, a 50 per cent increase from 2019, 6.5 times that of China and 1.9 times that of Europe. In the same year, the number of Indian students studying in US universities also reached 269,000, which is 93% of the total number of Chinese students in the US, 9.3 times the total number of British, French and German students in the US, and the number of Indian students in the US increased by 39% compared to 2019.
Third, the successive yearly petition approval rates for the Extraordinary Ability Visa (EB-1A) show that at various stages, the US does not have a particular regional preference for immigrant approvals of exceptional talent. In 2010, the major European countries topped the charts with a 76.67% approval rate, followed by China at 67.72%, and India with a 54.07% approval rate. Between 2012 and 2016 showed a significant increase, but all countries saw a notable decline between 2016 and 2020. Major applicant countries such as China, India, the United Kingdom, France, and Germany all showed this trend, indicating that the US Citizenship and Immigration Services (USCIS) does not differentiate between single countries based on nationality or geography in the approval process. The overall trend continues to correlate strongly with USCIS adjudication standards.
Fourth, the number of U.S. nonimmigrant work visas granted to citizens of China, Europe, and India were all significantly affected by the Covid-19 Pandemic, but India and Europe recovered much more quickly than China. The number of Chinese, European and Indian citizens obtaining U.S. nonimmigrant work visas showed a stable or slowly rising trend before the Pandemic, while during the Pandemic, they were all hit by a huge impact, reaching the lowest value in nearly a decade. After the Pandemic, the number of nonimmigrant work visas granted to citizens of Europe and India rebounded rapidly, with the total number of nonimmigrant work visas granted to European citizens to travel to the U.S. in 2022 and 2023 having recovered to about 220,000, or roughly 85 percent of the pre-epidemic level; and the number of nonimmigrant work visas granted to citizens of India reaching a new all-time high in 2023 at 442,421, or 1.5 times higher than the pre-epidemic level. Times. The number of Chinese citizens receiving nonimmigrant work visas recovers more slowly, with the total number of Chinese citizens receiving U.S. nonimmigrant work visas recovering to 48,338 in 2023, only half the number in 2019.
Fifth, in the wake of the Pandemic, the number of Chinese nationals obtaining U.S. nonimmigrant work visas declined sharply, and the number of immigrant visas obtained in the professional category increased significantly. The total size of nonimmigrant work visas and occupational immigrant visas granted to Chinese nationals remained around 100,000 per year, a number that peaked in 2018 at 112,935 visas. Numbers declined significantly during the Pandemic and bottomed out in 2021, with only 30,624 visas granted to Chinese citizens in both categories. After 2022, the number of Chinese citizens obtaining visas in both categories rebounded dramatically, recovering to 72,246 in 2023, or 64 percent of the pre-epidemic level. The total number of U.S. nonimmigrant work visas granted to Chinese citizens recovered to 48,338 in 2023, or half of what it was in 2019. And the number of Chinese who obtained U.S. occupational immigrant visas continued to climb for two consecutive years in 2021 and 2022, reaching a near-decade peak of 32,525 in 2022, or 1.95 times the number in 2019. Among them, the number of Chinese nationals obtaining U.S. immigrant visas in the First Preference Employment Based Immigration (EB-1) also reaches a record high of 11,425 in 2022.
Sixth, China is gradually changing from being a single source country of international talents to playing multiple roles as a source, transit, and destination country. This is evident in China’s international migration flow and international student flow and is also reflected in China’s declining remittance receipts and rising remittance exports. In the future, the governance of China’s international talent flow should be optimized from the following aspects: First, explore the establishment and improvement of the skilled immigration system, and give play to the backbone role of the skilled immigration system in the introduction of foreign talents; Second, improve the whole chain management system for international students, and strengthen efforts to promote the work of studying in China to play the role of “gathering talents” and “using talents”; Third, establish a more inclusive governance concept, and examine the issue of migration with an open, inclusive, fair and just attitude; Fourth, strengthen exchanges and cooperation with international organizations and give full play to their role in exchanges, dialogue, consensus building and professional services; Fifth, encourage social forces to participate in the co-governance of immigration, and build a diversified governance system led by the government and united with relevant stakeholders; Sixth, we will try out a more open visa policy, expand the scope of unilateral visa-free countries, and improve the electronic level of visas to China. Seventh, we will create a more international living environment and solve the problems of foreigners’ difficulty in payments and Internet access.
I. The Global Landscape of Talent Mobility
(I) International Talent Mobility has entered a New Paradigm
1. The intricate international landscape and escalating geopolitical conflicts have intensified the global competition for talents
In recent years, the international landscape has undergone complex changes. The profound impact of the COVID-19 pandemic has reshaped the global order, giving rise to a more pronounced trend towards multipolarity, deeper interdependence, accelerated digitalization, and strengthened regional cooperation. Simultaneously, the ongoing Russia-Ukraine conflict for over two years and the prolonged Israeli-Palestinian conflict that has exceeded six months have heightened international tensions. By the end of September 2023, data from the United Nations High Commission for Refugees revealed that the number of people forced to flee worldwide due to conflict, persecution, and violence has reached 114 million, posing a severe challenge to the stability of regions such as the Middle East, Europe, and the post-World War II global security framework.
Currently, despite the twists and turns of economic globalization, it continues to be seen as a primary driving force for global progress. Back to 1950, the global trade totals only $63 billion, whereas by 2022, this figure had soared to about $25 trillion, marking a growth of nearly 400 times. As opposed to military alliances and confrontations, economic cooperation can better promote the prosperity and development of all countries. Against this backdrop, globalization will continue to deepen, with talents playing a crucial role in driving socio-economic recovery, fostering innovative transformations, and addressing future challenges. As a result, the global competition for talent will intensify significantly.
2. International talents have become a significant force driving innovation and entrepreneurship in developed countries and regions
The United Nations’ “Transforming Our World: The 2030 Agenda for Sustainable Development” emphasizes that migrants make positive contributions to inclusive growth and sustainable development. Innovation, as a longstanding driving force for national and societal development, hinges on talents as the most critical and vibrant element of innovation. Innovation thrives on the collision of diverse peoples from different countries, races, and cultures. Against the backdrop of deepening globalization, the international mobility of talents has become a common phenomenon, showing an increasingly significant driving force for economic growth and industrial upgrading in host countries.
For example, in the miraculous economic growth of Singapore in the 1990s, 40% of the credit was attributed to the wisdom and hard work of foreign migrants. In 2021, Germany admitted 532,000 long-term or permanent immigrants, significantly enhancing its research strength. During the same year, over half (52%) of the research positions at the Max Planck Institute for the Advancement of Science in Germany were held by foreign scholars, particularly in its postdoctoral and doctoral student communities where foreign individuals overwhelmingly dominated. Data from 2022 showed that the United States, as the largest remittance-sending country globally, had an outward remittance total of approximately $79 billion, indirectly reflecting the continued contributions of overseas migrants to the economy of their home countries. In the same year, the United States issued around 1.02 million green cards (Permanent Resident Card), underscoring its attractiveness to international talents. It is worth noting that in the United States, immigrants are not only the drivers of social diversity but also the leaders of innovation: a quarter of the country’s startups are founded by immigrants, and among the top 500 companies globally, 43% of United States’ enterprises have rooted in the immigrants’ entrepreneurship. This indicates the significant role that international talents play in driving innovation and entrepreneurship in developed countries.
3. Countries are adjusting their immigration policies to attract the talent they need
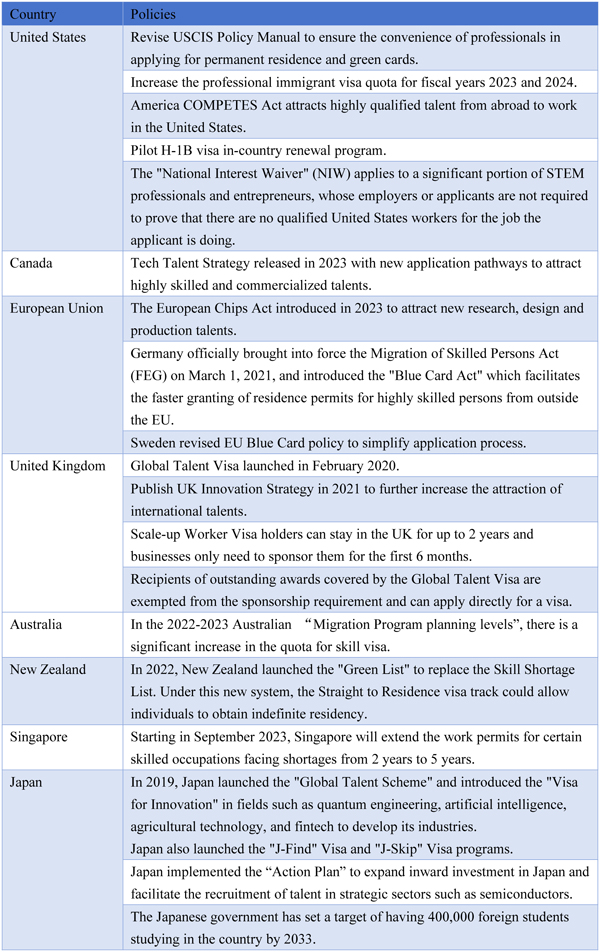
The international mobility of talents has become the focal point of development strategies for various countries. Many nations are racing to adjust their policies, actively constructing more attractive international talents development environment through measures such as optimizing policies, streamlining procedures, and increasing quotas. Countries aim to seize the competitive edge in the competition for global talent in the new global landscape. A summary of policies from key countries is presented below.
Table 1 Recent policies to attract international talent in key countries
4. Relevant Definitions and Explanations of Global Talent
There is currently no unified definition of international talent globally. This report defines international talent as individuals who possess an international perspective and certain professional knowledge or skills, are well-versed in international practices and rules, are able to compete in cross-cultural environments and engage in creative work and are capable of making positive contributions to society and humanity. International talent mobility refers to the global movement of international talent across nations and regions. In this report, the movement of international talent refers to the mobility of highly qualified international migrants. Referencing the definitions of international migrants from relevant international organizations and scholars, international migrants are individuals who leave their country of origin or previous country of residency, and migrate to another country, legally or illegally, to engage in non-state affairs.
The key group of international talents analyzed in this report are international students and international migrants with a specific focus on holders of skilled worker visas, highly skilled individuals, and investment-based (occupational) immigrants. In this report, unless otherwise specified, data from China refers to data from mainland China and does not include data from Hong Kong Special Administrative Region, Macao Special Administrative Region, and Taiwan Province.
(II) The Current Status of International Migration Flow
1. The number of international migrants continues to grow, primarily flowing from developing countries such as India and Mexico to developed countries like the United States and Germany
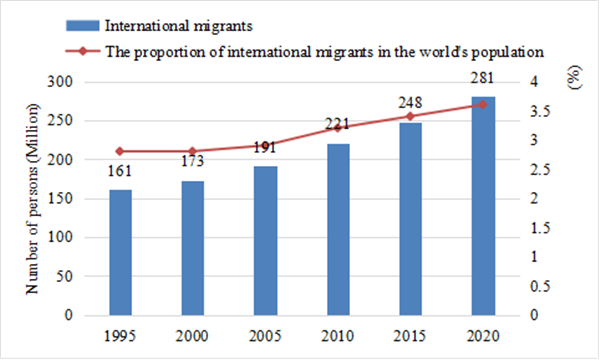
According to data from the United Nations Department of Economic and Social Affairs, in 2020, nearly 281 million people were residing in countries other than their countries of birth, a 62.4% increase from the 173 million in 2000 and an 83.7% increase from the 153 million in 1990, marking a 3.35-fold increase from the 84 million in 1970. The proportion of international migrants to the global population has also gradually increased from 2.8% in 2000 to 3.6% in 2020, showing a trend of growth in both total numbers and proportions.
Figure 1 Number and proportion of international migrants, 1995-2020
Data Source: IOM. World Migration Report 2024.
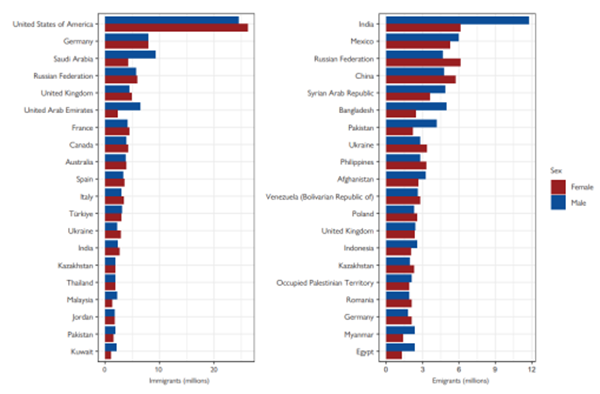
In 2020, the United States, as a preferred destination for international migrants, welcomed over 51 million individuals. Among them, Mexico stood out as the primary country of origin, with approximately 10.85 million emigrants, followed by India (around 2.72 million) and China (around 2.18 million). Germany ranked as the second-largest destination country with close to 16 million international emigrants, mainly originating from Poland (2.14 million) and Turkey (1.84 million). Saudi Arabia followed with 13 million international emigrants, while Russia and the United Kingdom ranked fourth and fifth with approximately 12 million and 9 million international emigrants, respectively. India emerged as the largest emigration country globally, with around 18 million individuals residing overseas, predominantly heading to the United Arab Emirates, the United States, and Saudi Arabia. Mexico ranked second with approximately 11 million emigrants, the vast majority (about 10.85 million) heading toward the United States. Russia closely followed with around 10.8 million emigrants. China placed fourth with about 10 million emigrants scattered worldwide, including over 2 million migrants residing in the United States, and 800,000 and 770,000 migrants moving to South Korea and Japan, respectively.
In numerous countries in North America and Europe, including the United States, Canada, France, Spain, Italy, as well as India, the number of female international migrants accepted exceeds that of males. Conversely, in major immigration destination countries in Asia, especially in the Gulf Cooperation Council (GCC) countries such as Saudi Arabia, the United Arab Emirates, and Kuwait, the number of male international migrants accepted far surpasses that of females. This phenomenon also reflects the unique industrial structure and specific social environments in these countries.
Figure 2 International migrants, by sex, top 20 destination countries (left) and origin countries (right) (millions)
Data Source: IOM. World Migration Report 2024.
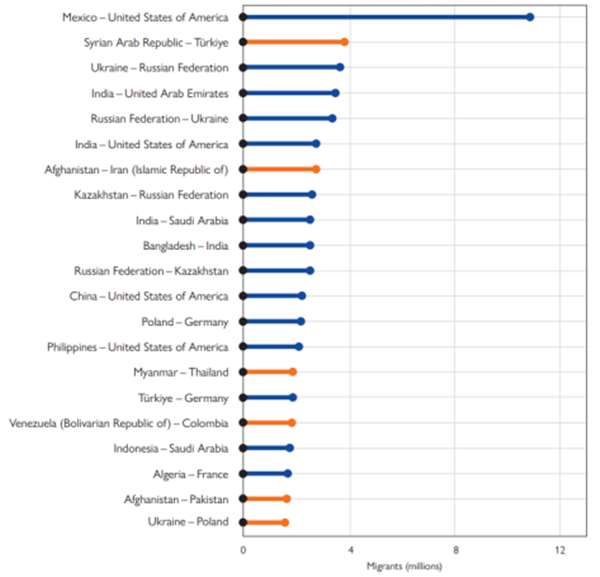
According to the World Migration Report 2024, the most significant international migration corridor globally is the one from Mexico to the United States, with nearly 11 million people migrating through this route. Following closely is the migration corridor from Syria to Turkey, primarily involving large-scale refugee movements resulting from the Syrian civil war. Ranked third is the migration corridor from Ukraine to Russia, involving nearly 4 million individuals, while the reverse migration from Russia to Ukraine constitutes the fifth-largest migration corridor. These movements between Russia and Ukraine are caused by displaced individuals following the outbreak of the Russia-Ukraine conflict in 2022. The migration corridors from India to the United States and from China to the United States rank sixth and twelfth, respectively. These two migration corridors are predominantly driven by skilled migration, further highlighting the enduring attractiveness and significance of the United States as a preferred destination for immigrants.
Figure 3 Top International country-to-country migration corridors, 2024
Data Source: IOM. World Migration Report 2024.
Notes: Those corridors comprising mainly displaced persons are colored orange.
2. Approximately two-thirds of the international migrant population consists of migrant workers, distributed mainly in developed countries across Europe, America, and the Middle East
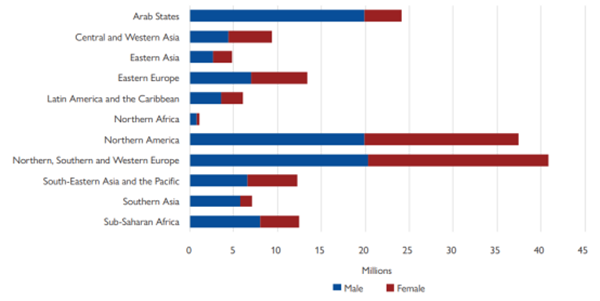
In 2019, approximately 169 million international migrants were actively seeking or already working in their destination countries worldwide, accounted for 62% of the total international migrant population (around 272 million) that year and represented 69% of the international working-age migrant population (approximately 245 million). These migrant workers are primarily located in three major regions: (1) the Northern, Southern, and Western European regions, with a concentration of around 41 million migrant workers; (2) North America, which draws in approximately 37 million migrant workers; and (3) the Arab countries, hosting about 24 million migrant workers. The Arab nations serve as one of major recipients of international migrant workers, with migrant workers constituting 41.4% of their labor force and playing crucial roles in various key economic sectors. These three regions alone house over 100 million international migrant workers, accounting for approximately 60% of the total international migrant worker population. It is worth noting that in certain regions, there is a significant gender imbalance among migrant workers, particularly in South Asia, where there are around 5.7 million male migrant workers and 1.4 million female migrant workers. A similar discrepancy exists in Arab countries, where male migrant workers number around 19.9 million, compared to approximately 4.2 million female migrant workers. The significant disparity in the gender distribution of migrant workers in these areas is closely linked to traditional gender role perceptions, the demand structure of the labor market, and societal cultural factors. These factors collectively contribute to the more dominant presence of men in the international labor market in these regions.
Figure 4 Geographic distribution of migrant workers by sex (millions)
Data Source: IOM. World Migration Report 2024.
3. Highly skilled migrant workers are a priority for countries to attract
As of 2019, nearly 66.2% of international labor force were engaged in basic service industries, providing adequate labor supplement to local countries and regions. However, very few of them are engaged in high-tech and innovative work. With the global economy back on track and cutting-edge high-tech breakthroughs occurring all the time, competition for top international talent is increasingly heating up, which can be easily seen from the changes in the number of United States professional immigrant visas and EU Blue Cards issued.
In the United States, highly skilled work immigrants are categorized under the Employment-Based Preference (EBP) category of immigrant visas. The number of visas issued in this category grew from 28,538 in 2019 to 46,508 after the Covid-19 Pandemic. The EU Blue Card is a legal work and residence card for highly skilled people from outside the EU. According to statistics, approximately 82,000 Blue Cards were granted to highly skilled non-EU personnel during 2022. Of these, Germany was the largest issuer, with around 63,000 Blue Cards issued, or 77% of the total issued during the year. Poland followed with 5,000 cards, or 6% of the total, while Lithuania and France each issued 3,900 cards, or 5% of the total. In terms of the distribution of nationalities of card recipients, Indian citizens were the largest group of beneficiaries, receiving around 20,000 EU Blue Cards in 2022, accounting for 24% of the total number of cards issued that year. Russian citizens were second with 8,000 (9%) and Turkey was third with 5,000 (6%).
(III) Current State of Global International Student Mobility
1.International students have tripled over the past 20 years, with growth slowing down after the COVID-19 pandemic
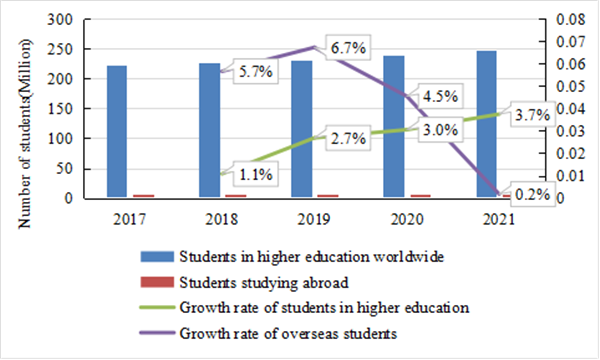
According to UNESCO’s statistics and projections, the number of international students in higher education worldwide increased from 2.11 million in 2000 to 6.39 million in 2021, marking a triple of international students from 2000 to 2021. Between 2018 and 2020, the growth rate of the number of international students worldwide exceeded that of students in higher education worldwide. During the COVID-19 pandemic, the number of international students continued to increase, albeit at a slower pace, with the growth rate decreasing from 6.7% in 2019 to 0.2% in 2021. Consequently, the growth rate of the number of international students in 2021 lagged behind that of students in higher education.
Figure 5 The number and growth rate of students in higher education worldwide and students studying abroad, 2017-2021
Data Source: UNESCO.
2.International students primarily flow from developing countries such as China and India to educational powerhouses like the United States and the United Kingdom. There is significant bi-directional flow of international students between the United States, China, Germany, and France
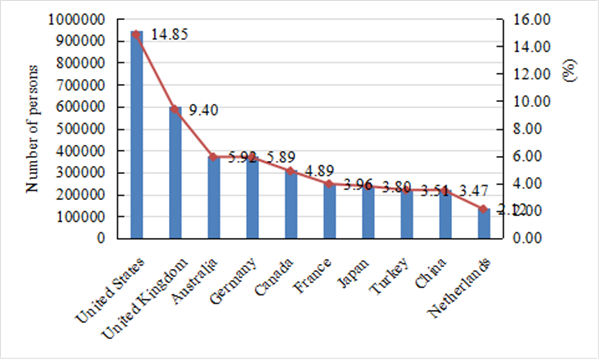
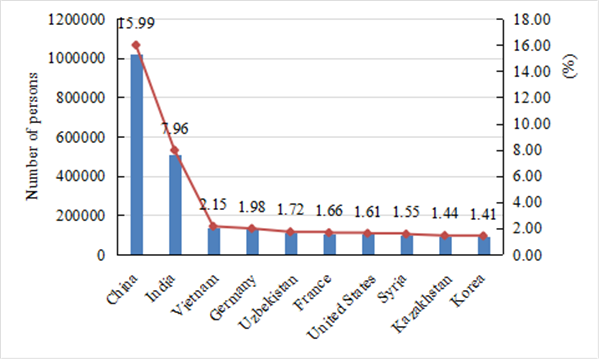
International students mainly flow from developing countries to developed countries. The United States is the top destination for international study, followed closely by the United Kingdom, Australia, Germany, and Canada. In 2021, 24.3% of international students were studying in the United States and the United Kingdom. China and India serve as the most significant sources of international students, accounting for 23.9% of the global international student population.
Figure 6 The number and proportion of international students in the higher education system of the top 10 destination countries in 2021
Data Source: UNESCO. Number and rates of international mobile students. IIE.
Figure 7 The number and proportion of international students studying abroad in the top 10 countries of origin in 2021
Data Source: UNESCO. Number and rates of international mobile students.
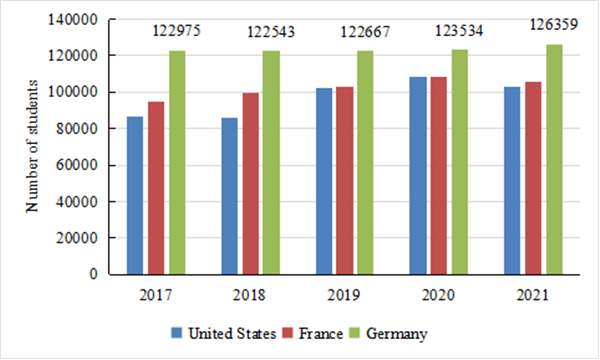
The United States, China, Germany, and France are not only in the top ten positions in the list of destinations for international studies, but also among the top ten countries of origin of international students. This dual role highlights their significance in the global education exchange system, showcasing them as both providers and consumers of high-quality education who actively participate in international education and interactions. For instance, between 2017 and 2021, Germany maintained an annual number of over 120,000 students studying abroad; the annual number of international students from the United States and France also remained stable at around 100,000. This reflects the continuous efforts of developed countries to promote international academic and cultural integration among their students. Thus, it is evident that the international mobility of students is not solely driven by the students’ appeal for knowledge in developing countries, students from developed countries also demonstrate a sustained demand for cross-border educational experiences.
Figure 8 The number of students studying abroad in the United States, France and Germany, 2017-2021
Data Source: UNESCO.
II. Characteristics of International Talent Mobility with the United States as a Hub
(I). Characteristics of Talent Mobility from China to the United States
1. Characteristics of Chinese work visas and employment-based immigrant mobility to the United States
Chinese immigrants to the United States (non-student immigrants) include two main groups: short- and long-term workers who hold Non-immigrant Work Visas (NV), and highly talented and highly invested individuals who apply for Employment-Based Immigrant Visas (IV). In this section, work visas are mainly analyzed under the H (employer-sponsored work visa), L (multinational executive work visa), O (extraordinary ability work visa), and J (visiting scholar) categories. Immigrant visas are mainly EB-1 (employment-based first preference immigrants, including: EB-1A workers with extraordinary abilities, EB-1B outstanding professors, and EB-1C multinational executives), EB-2 (second preference higher skilled), EB-3 (third preference skilled worker), and EB-5 (investor immigrants).
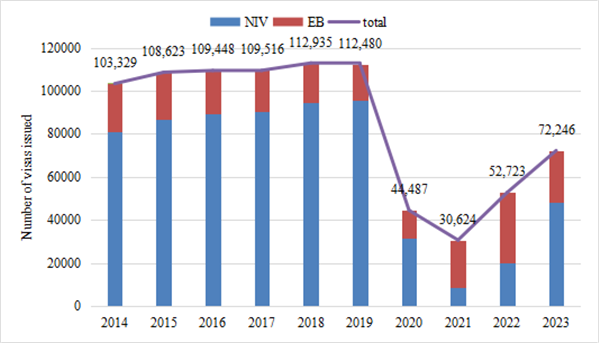
The overall trend in the number of Non-immigrant Work Visas and Employment-Based Immigrant Visas granted to Chinese nationals shows that Non-immigrant Work Visas take up a larger share of the total. The total size of Non-immigrant Work Visas and Employment-Based Immigrant Visas for Chinese nationals to the United States has remained around 100,000 over the years, a number that peaked in 2018, totaling 112,935 visas. Numbers dropped significantly during the Covid-19 Pandemic and bottomed out in 2021, with only 30,624 visas issued to Chinese nationals in both categories. After 2022, the number of Chinese nationals obtaining visas in both categories rebounded sharply, recovering to 72,246 in 2023.
Figure 9 The number and trend of China’s non-immigrant work visas and employment-based immigrant visas to the United States, 2014-2023
Data Source: USCIS.
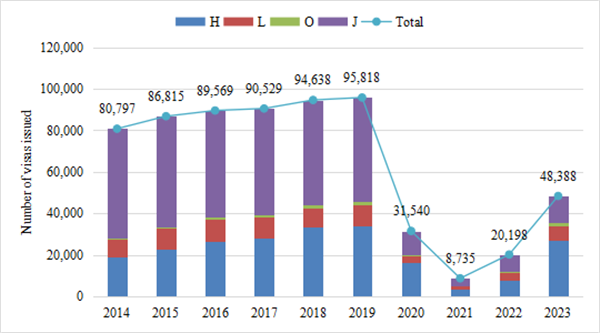
The issuance of Chinese Non-immigrant Work Visas to the United States continued to grow steadily prior to the Covid-19 Pandemic, reaching an all-time high in 2019, with a total of 95,818 people receiving visas in this category. During the Pandemic, the category took a huge hit, with a sharp drop in the number of applicants. With subsequent policy relaxations, the number of applications has rebounded significantly, and the total number of Chinese nationals granted Non-immigrant Work Visas to the United States has recovered to 48,338, according to the most recent data available for 2023.
Figure 10 The number and trend of China’s non-immigrant work visa to the United States, 2014-2023
Data Source: USCIS.
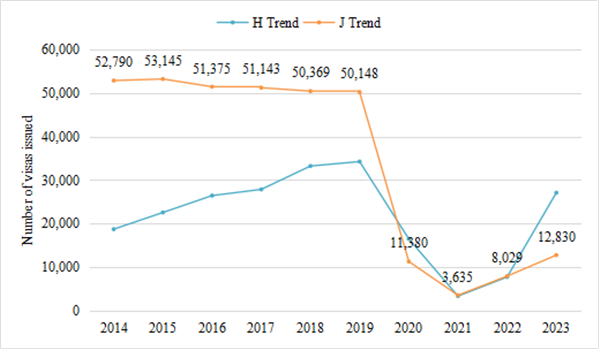
Prior to the Covid-19 Pandemic, J visas (exchange visitors) were the dominant Non-immigrant Work Visas for Chinese nationals traveling to the United States, with a peak share of 65.3 percent. H visas grew year by year prior to the Pandemic and surpassed J visas in the latter stages of the Pandemic, becoming the dominant group of Non-immigrant Work Visas for Chinese nationals to the United States.
Figure 11 The number and trends of Chinese non-immigrant work visa H and J in the United States, 2014-2023
Data Source: USCIS.
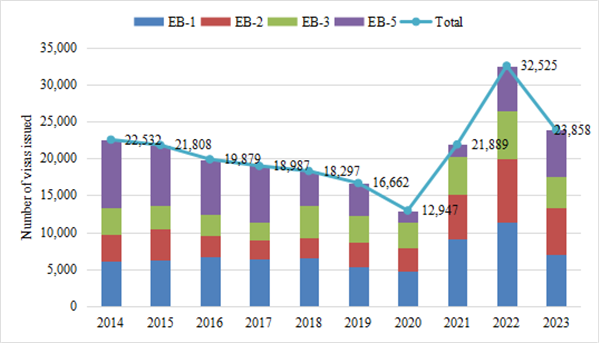
Unlike Non-immigrant Work Visas, the number of Chinese nationals applying for Employment-Based Immigrant Visas rose rather than fell during the Covid-19 Pandemic. Between 2014 and 2020, the number of Chinese nationals obtaining United States immigrant visas in the employment category declined steadily, from 22,532 in 2014 to 12,947 in 2020. It then continues to rise in 2021 and 2022, reaching a near-decade peak of 32,525 in 2022.
Figure 12 The number and trend of China’s employment-based immigrants of different categories to the United States, 2014-2023
Data Source: USCIS.
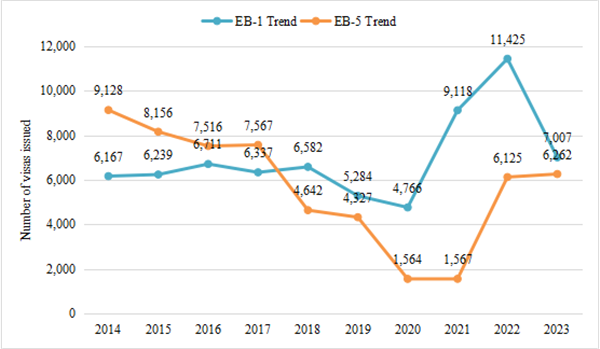
Of these, the number of Chinese nationals obtaining visas in the EB-1 category also reached a record high of 11,425 visas in 2022.The EB-5 category of immigrant investor has long been the primary choice for Chinese immigrant visas to the United States, at one point accounting for as much as 40.5% of all visas. With the shutdown of the EB-5 program, the number of Chinese nationals obtaining EB-5 visas declined each year from 2014 to 2020, and for the first time in 2018, fell below the number of those obtaining EB-1 visas. In an effort to attract the high investment category, USCIS passed a new regulation on March 15, 2022, which eliminated the scheduling limit for EB-5 immigrant investors, and the number of Chinese nationals obtaining EB-5 visas resumed in 2023 at 6,262 visas.
Figure 13 The number and trends of China’s employment-based immigrant visas to the United States, 2014-2023
Data Source: USCIS.
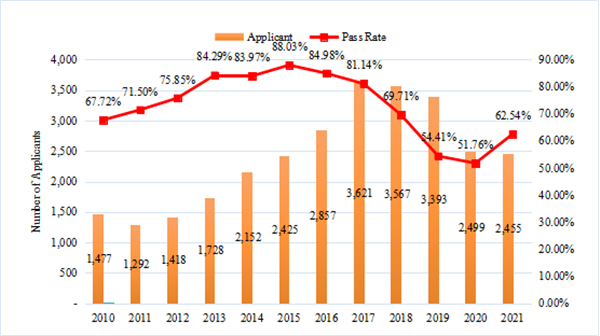
Throughout all employment-based immigration categories, the EB-1A Extraordinary Ability Visa is the most highly vetted outstanding talent immigration channel for applicants in the entire United States EB employment-category. The number of EB-1A applications in mainland China remained at roughly 1,200 until around 2011, then surpassed 2,000 for the first time in 2014 and has been growing ever since. This number of applications surpassed 3,000 and peaked at 3,621 in 2017. The number has also remained at around 2,500, although the Covid-19 Pandemic has had a small hit on the number of applications. The pass rate has risen from an early 67.72% in 2010 as the number of applicants has risen, exceeding 80% for the first time in 2013 and peaking at 88.03% in 2015, before falling back as the number of applicants declined. By 2020, during the Pandemic, the pass rate hit a low of just 51.76% before the numbers rebounded.
Figure 14 The number of China’s EB-1A applicants and pass rate, 2014-2023
Data Source: USCIS.
2. Characteristics of Chinese student mobility to the United States
China remains the primary source of international students in the United States. In the 2022/23 academic year, Chinese international students accounted for 27.4% of all international students in American higher education institutions, making China the largest contributor to the international student in the United States From 2006 to 2019, the number of Chinese students studying in the United States experienced rapid growth. However, following the outbreak of the Covid-19 pandemic in 2020, the number of Chinese students studying in the United States saw a steady decline. Nevertheless, in the 2022/2023 academic year, although the number of Chinese students in the United States continues to decrease, there is a visible trend towards stabilization. Compared to the 8.6% decline observed in the 2021/22 academic year, there was a decrease of 0.2% in the number of Chinese students studying in the United States in 2022/2023, indicating that Chinese students studying in the United States are on the rebound.
Figure 15 The number of Chinese students studying in the United States, 2000/01-2022/23
Data Source: IIE, Open Doors 2023.
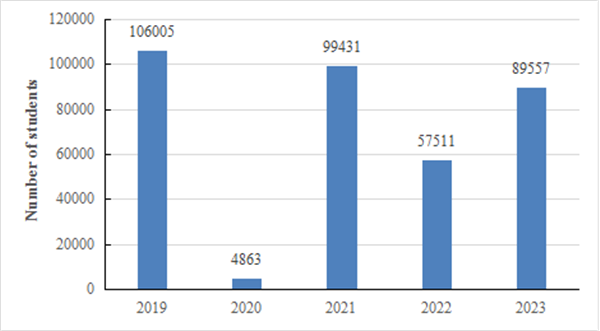
This rebound is also reflected in the number of F1 student visas issued that year. In 2023, a total of 89,557 Chinese students were granted F1 visas, marking a 55.7% increase compared to 57,511 in 2022 and reaching 84.5% of the 106,005 in 2019 before the epidemic.
Figure 16 The number of Chinese students receiving F1 visas in the United States, 2019-2023
Data Source: United States Department of State – Bureau of Consular Affairs.
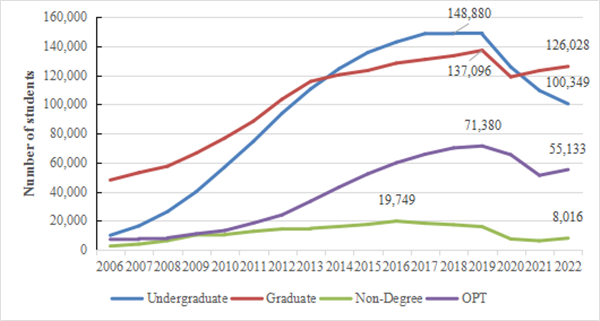
External factors significantly influence the number of undergraduate Chinese students in the United States. The rapid growth in the number of Chinese undergraduate students studying in the United States from 2006 to 2019 reflected China’s robust economic development. The surge in the number of Chinese undergraduate students in the United States occurred from the academic year 2006/07 to 2018/19, with a slight slowdown in growth around 2013 but still maintaining an upward trend, reaching its peak in the 2018/19 academic year where the number of students was 14 times higher than that in the 2006/07 academic year. Due to factors such as the COVID-19 pandemic, the number of Chinese undergraduate students studying in the United States witnessed a rapid decline from the 2019/20 academic year to the 2020/21 academic year; however, from the 2020/21 academic year to the 2022/23 academic year, although the number of Chinese undergraduate students in the United States continued to decrease, the rate of decline slowed down.
Graduate education in the United States have always held great appeal for Chinese international students. The number of Chinese students pursuing graduate degrees in the United States peaked in the 2019/20 academic year and experienced a significant decrease in the 2020/21 academic year (the only decline in the 17-year period from 2006 to 2022). However, soon after the decrease and even before pandemic control measures came to an end, the number quickly rebounded and continued to rise again. The number of students pursuing non-degree and Optional Practical Training (OPT) programs also saw a decrease under the influence of the pandemic, but the recovery began later than that of Chinese graduate students in the United States, with growth not observed until the 2021/22 academic year.
Figure 17 The number of Chinese students studying in the United States in different degrees, 2006-2022
Data Source: IIE, Open Doors 2023.
(II) Characteristics of Talent Mobility from European Countries to the United States
1. Characteristics of Work Visa and Employment-Based Immigration Mobility from Europe to the United States
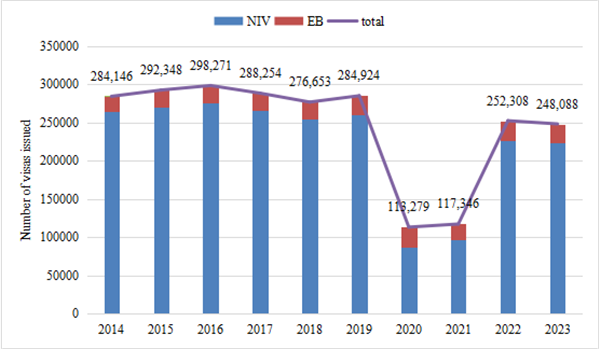
The overall trend of non-immigrant and employment-based immigration from Europe to the United States reveals a significant proportion of non-immigrant work visas. Notably, the pandemic has had a discernible impact on the number of applicants for non-immigrant work visas, while the count for employment-based immigration applicants has remained relatively stable. Prior to the pandemic, there was a consistent figure of approximately 280,000 individuals obtaining either non-immigrant work visas or employment-based immigration visas for European citizens traveling to the United States. This reached its peak in 2016 with a total of 298,271 people. However, during the pandemic period, there was a substantial decrease in applicants resulting in only 113,279 individuals receiving such visas in 2020 – marking an all-time low. Encouragingly though, by 2022 there was a rebound as European citizens obtained around 250,000 combined visas.
Figure 18 The number and trend of NIV (non-immigrant work visas) and EB (Employment-Based) immigrant visas from Europe to the United States, 2014-2023
Data Source: USCIS.
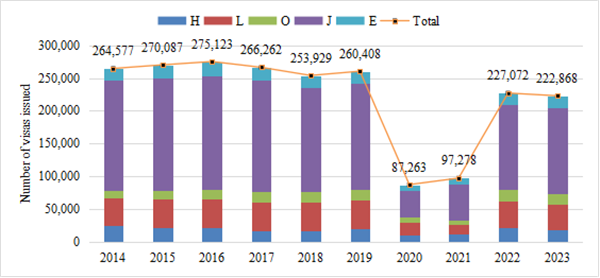
The issuance of non-immigrant work visas from Europe to the United States remained stable prior to the pandemic, hovering around 260,000, reaching a historical peak in 2016 with a total of 275,123 individuals receiving such visas. During the pandemic, this category experienced a significant decline, with the number of European citizens obtaining non-immigrant work visas in 2020 falling to less than one-third of that in 2016, amounting to 87,263 individuals. With subsequent policy relaxations, the number of applicants rebounded significantly, and by 2022 and 2023, the total number of European citizens receiving non-immigrant work visas to the United States had returned to approximately 220,000.
Figure 19 The number and trend of non-immigrant work visa of different categories from Europe to the United States, 2014-2023
Data Source: USCIS.
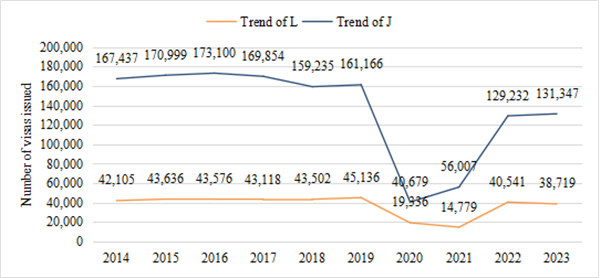
For non-student talent from Europe seeking non-immigrant work visas in the United States, in addition to categories H, L, O, and J, the E-category Treaty Investor visas also constitute a notable share. Preceding the pandemic, the J visas (for exchange visitors) was the predominant choice among European nationals, peaking at a 63% share of the total non-immigrant work visas issued. The L visas, designated for intra-company transferees, consistently ranked as the second most common non-immigrant work visa for European nationals, with an average annual approval rate of approximately 40,000 individuals.
Figure 20 The number and trends of non-immigrant J and L Visas from Europe to the United States, 2014-2023
Data Source: USCIS.
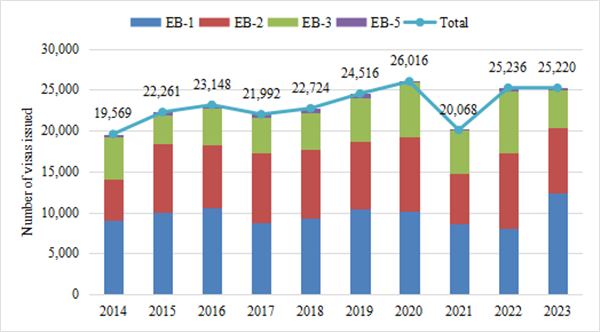
The issuance of employment-based immigrant visas for European applicants remains highly stable. Even during the pandemic, the number of individuals obtaining employment-based immigrant visas stayed above 20,000, reaching a decade-high of 26,016 in 2020, and despite a decline in 2021, it was still higher than in 2014. By 2022 and 2023, the figure returned to around 25,000. Among the employment-based immigrant visas, the EB-1 and EB-2 categories are the top choices for European applicants, while the EB-5 category accounts for a very low proportion, even less than 2%.
Figure 21 The number and trend of EB visas from Europe to the United States, 2014-2023
Data Source: USCIS.
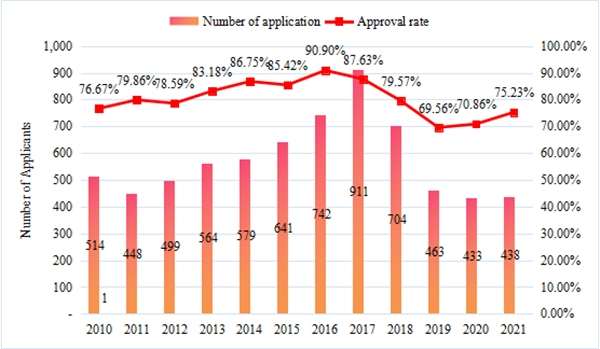
The number of EB-1A Extraordinary Ability applications from the United Kingdom, France, and Germany had been consistently around 500 before and around 2011, reaching a peak for the first time in 2017 with over 900 applications, after which there has been a declining trend. The pandemic had some impact on the applications, but without a significant shock, the number of applications returned to the scale of about 450, similar to the same period in 2011. The approval rate for applicants from the United Kingdom, France, and Germany has been relatively stable, ranging between 76% and 90%. There was also a noticeable correction after the peak of 90.9% in 2016, falling to a low of 69%. The latest recorded approval rate in 2021 is 75.23%.
Figure 22 The number of EB-1A applications and approval rates for applicants from the major European countries, 2014-2023
Data Source: USCIS.
2. Characteristics of European student mobility to the United States
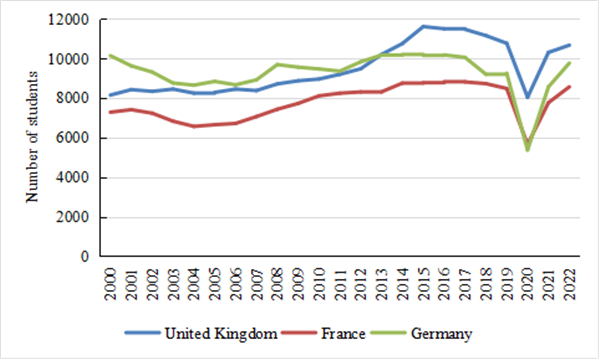
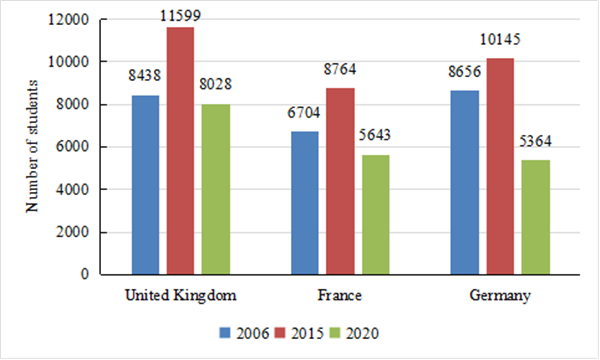
Europe has always been an important source of international students in the United States. In 2023, three European countries are included in the top 20 source countries for international students in the United States. These countries are the United Kingdom in 15th place (1% share), Germany in 17th place (0.9% share), and France in 20th place (0.8% share). Overall, the number of European students studying in the United States has been relatively stable, with a rapid upward trend from 2006 to 2015. Taking the examples of the United Kingdom, France, and Germany, the numbers of their international students in the UNITED STATES increased by 37.5%, 30.7%, and 17.2% respectively during this decade. However, following the impact of geopolitical factors and the COVID-19 pandemic, the number of European students studying in the US began to decline and hit its lowest point in 2020 since the beginning of the 21st century. In May 2021, as several European countries gradually lifted their epidemic prevention restrictions as planned, the United States also reopened its borders to vaccinated international travelers in November of the same year. Consequently, the number of European students studying in the US started to recover, with the figures for the United Kingdom, France, and Germany reaching 91.9%, 97.6%, and 96.1% of their 2015 level at the same period, respectively.
Figure 23 The number of students from major European countries studying in the United States, from 2000/01 to 2022/23 academic year
Data Source: IIE, Open Doors 2023.
Figure 24 Comparison of the number of students from major European countries studying in the United States in 2006, 2015 and 2020
Data Source: IIE, Open Doors 2023.
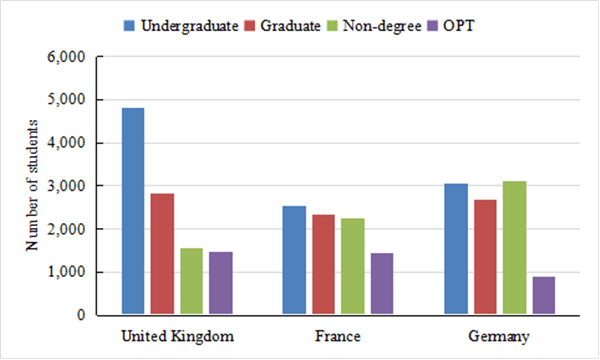
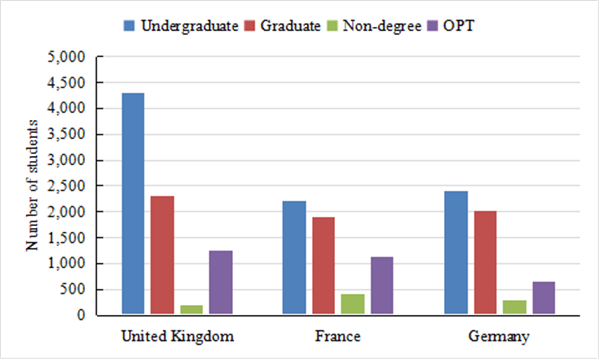
European students studying in the United States are primarily undergraduate students. Taking the examples of the United Kingdom, France, and Germany, in the 2022/2023 academic year, the proportion of undergraduate students from these countries studying in the US accounted for 45.1%, 29.7%, and 31.3% of the total number of their students in the US, respectively. During the 2020/2021 academic year, when European students studying in the US were most severely affected by the pandemic, European students studying in the United States were most notably characterized by undergraduate students. Specifically, in that year, undergraduate students from the United Kingdom, France, and Germany accounted for 53.6%, 39.0%, and 44.8% respectively of the total number of students from their respective countries studying in the United States.
Figure 25 Comparison of the number of students from major European countries studying in the United States at different levels of education in 2022/2023
Data Source: IIE, Open Doors 2023.
Figure 26 Comparison of the number of students from major European countries studying in the United States at different levels of education in 2020
Data Source: IIE, Open Doors 2023.
(III) Characteristics of Talent Mobility from India to the United States
1. Characteristics of India’s Work Visa and Employment-based Immigration Mobility to the United States
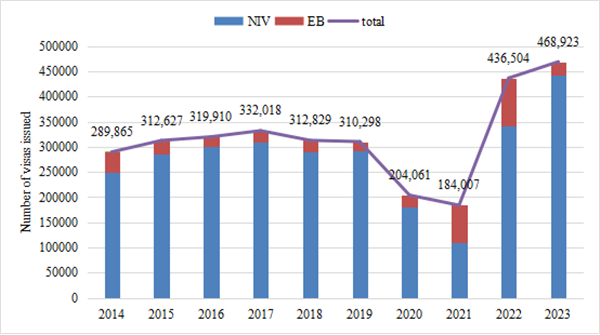
The overall trend in the number of non-immigrant work visas and employment-based immigrant visas from India to the United States also shows that non-immigrant work visas make up a very large portion of the total number of visas. The total number of visas issued in the Indian non-immigrant category rose steadily before the Covid-19 Pandemic, reaching a pre-event peak of 332,018 in 2017. During the Pandemic, the category took a huge hit causing a precipitous drop in the number of applicants. However, the number of visas issued in both categories rebounded steeply after the Pandemic, reaching an all-time peak of 468,923 in 2023.
Figure 27 The number and trends of non-immigrant work visas and EB immigrant visas for India to the United States, 2014-2023
Data Source: USCIS.
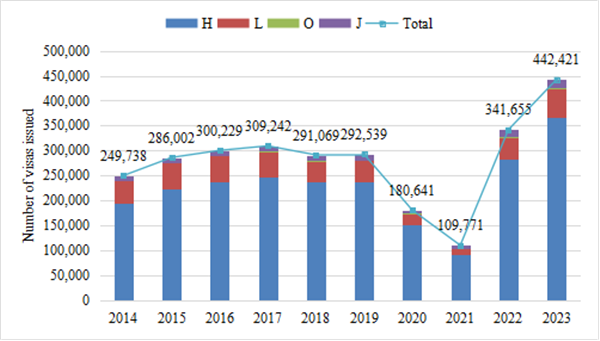
The issuance of non-immigrant work visas for India to the United States maintained a relatively steady increase prior to the Covid-19 Pandemic, reaching a near five-year peak in 2017 with a total of 309,242 issued. Issuance in this category declined sharply during the pandemic, reaching a nadir in 2021, with only 37.5% of the number issued in 2019. However, with the subsequent relaxation of policies in India and the United States, there was a very significant rebound, to 341,655 in 2022, surpassing the previous eight-year high, and a further increase in 2023, to 442,421, a three-fold increase from the trough of 109,771 in 2021, reaching a new all-time high.
Figure 28 The number and trends of non-immigrant work visas of different categories for India to the United States, 2014-2023
Data Source: USCIS.
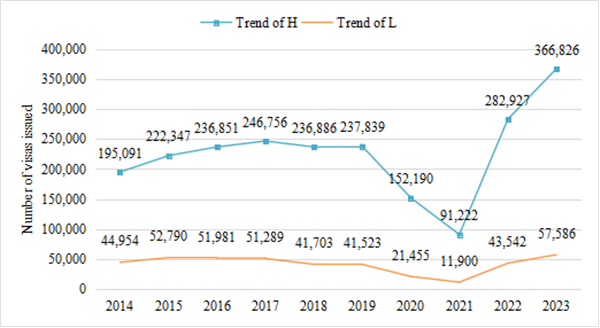
Of the non-immigrant work visas, H visas have been the top choice for Indians going to the United States, with the share peaking at 82%. L visas are another important gateway for Indians going to the United States The number of visas has stabilized between 40,000 and 60,000, except during the Covid-19 Pandemic.
Figure 29 The number and trends of Indian non-immigrant work visa H and J in the UNITED STATES, 2014-2023
Data Source: USCIS.
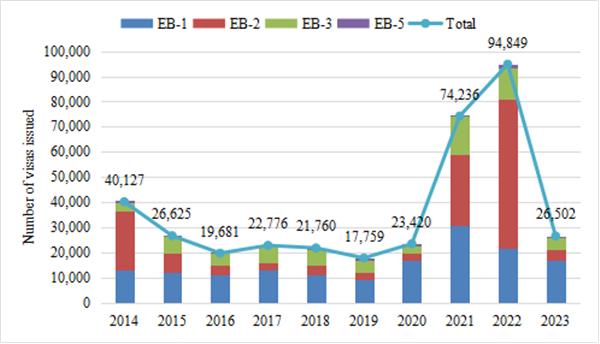
During the Pandemic, the number of applications issued by Indian citizens for employment-based immigrant visas to the U.S has not decreased, but increased. From 2014 to 2016, the number of employment-based immigrant visas issued to Indian nationals continued to decline, from 40,127 in 2014 to 19,681 in 2016. Thereafter, from 2016 to 2020, the number of issuances stayed around 20,000. The number of issuances continued to rise in 2021 and 2022, reaching a near-decade peak of 94,849 in 2022.
Figure 30 The number and trend of different categories of employment-based immigrant visas for India to the UNITED STATES, 2014-2023
Data Source: USCIS.
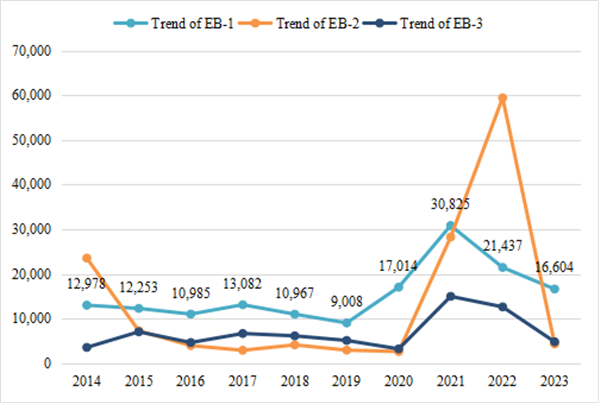
The EB-1, EB-2, and EB-3 categories are the top choices for Indian applicants, with the EB-5 category accounting only for a very low percentage, even less than 0.3% in some years. The number of issuances in the EB-1 category has steadily risen, peaking at 30,825 in 2021, with the EB-2 number exploding as high as 59,431 in 2022. The number of employment-based immigrant visas issued to Indian applicants has seen a spurt of growth in the wake of the Covid-19 Pandemic, peaking at a sizeable 74,236 in 2021 and 94,849 in 2022. The reason for this is highly related to Indians’ preference for the United States The many restrictions on non-immigrant visas during the Pandemic have caused more Indians to turn to the employment-based immigrant visa applications.
Figure 31 The number and trends of different Indian employment-based immigrant visas to the UNITED STATES, 2014-2023
Data Source: USCIS.
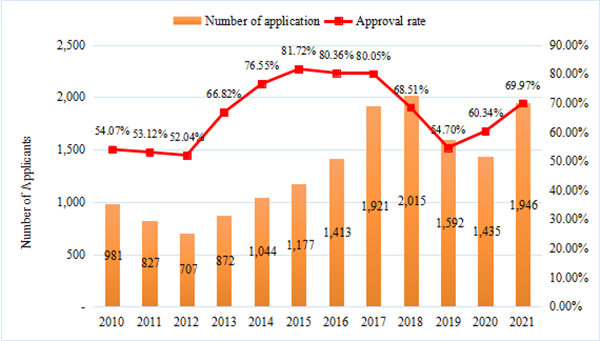
Indian EB-1A applicants have remained at roughly 800-1,000 filings around 2013. It grew significantly to 1,413 in 2016 and has been on an upward trend since then peaking at 2,015 in 2018. The Covid-19 Pandemic had some impact on Indian applications, but no significant hit, with the number of applications returning to a size of around 1,500 for the same period in 2016. India’s EB-1A application approval rate is relatively low, remaining in the 52%-80% range, with a significant pullback from a peak of 81.7% in 2015 before dropping to a low of 54.7%. In 2021, the most recent approval rate on record is 69.97%.
Figure 32 The number of EB-1A applicants and approval rate in India, 2014-2023
Data Source: USCIS.
2. Characteristics of Indian student mobility to the United States
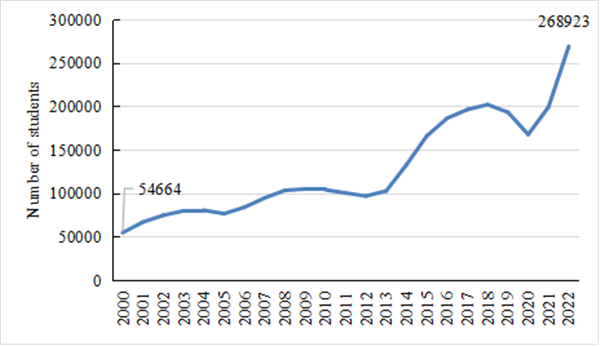
India stands as the second-largest source of international students in the United States. In the 2022/23 academic year, Indian students accounted for 25.4% of international students enrolled in American higher education institutions, second only to China. Since the 21st century, the number of Indian students studying in the US has maintained a rapid growth rate, increasing from 54,664 individuals in the 2000/01 academic year to 268,923 in the 2022/23 academic year, a remarkable 392.0% increase over the span of 22 years. Despite experiencing a temporary decline in the number of students studying abroad in the 2019/20 and 2020/21 academic years due to the impacts of the pandemic, the enthusiasm of Indian students for studying in the US surged once again as India eased its epidemic prevention and control measures. By the 2021/2022 academic year, the number of Indian students studying in the US had rebounded to 98.6% of the pre-pandemic peak level (2018). Furthermore, in the 2022/23 academic year, the population of Indian students in the US hit another record high, a 35% increase compared to the previous year, with a total of 268,923 individuals.
Figure 33 The number of students from India studying in the United States from 2000/01 to 2022/23 academic year
Data Source: IIE, Open Doors 2023.
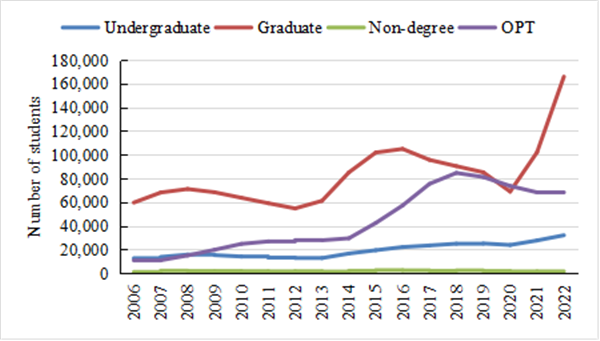
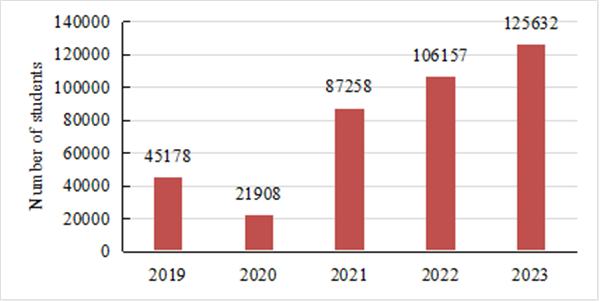
Indian students in the United States are primarily concentrated at the post-graduate level, and in OPT programs. In the 2022/23 academic year, graduate students accounted for 61.7% of Indian students studying in the United States, while those opting for the OPT program constituted 25.7%. Starting from 2021, as India gradually relaxed its epidemic control measures, the number of Indian students pursuing graduate degrees in the United States experienced a significant rebound. The average annual growth rate from the 2020/21 academic year to the 2022/23 academic year reached 55.2%, achieving in a historical peak of 165,936 students in the 2022/23 academic year. Furthermore, insights from the number of F1 student visas granted to Indian students also reveal the sustained enthusiasm of Indian students for studying in the United States. In 2023, a total of 125,632 Indian students were granted F1 visas, representing an 18.3% increase from 2022 and a substantial 44.0% surge from 2021. Compared to 2019, this number has nearly tripled, showcasing a robust strengthening of the intention of Indian students to study in the United States.
Figure 34 The number of students from India studying in the United States at different levels of education from 2000/01 to 2022/23 academic year
Data Source: IIE, Open Doors 2023.
Figure 35 The number of Indian students receiving F1 visas in the United States, 2019-2023
Data Source: United States Department of State – Bureau of Consular Affairs.
(IV)Summary of Characteristics of International Talent Mobility with the United States as a Hub
First, the global competition for international talent is increasingly intense, and the United States’ position as the world’s top talent gathering place and the preferred destination for international students has not fundamentally changed before and after the COVID-19 pandemic. In 2019, migrants from China, Europe and India received approximately 710,000 non-immigrant work visas and occupational immigrant visas. Meanwhile, 594,000 students from China, India and European countries such as Britain, France and Germany are studying at US institutions of higher education. Despite the impact of the epidemic, by 2023, the relevant data showed signs of recovery. The number of Chinese nationals granted these visas recovered to 64 percent compared to 2019, Europe recovered to 87 percent, and India showed strong growth, reaching 1.5 times that of 2019. As a result, the total number of U.S. nonimmigrant work visas and occupational immigrant visas granted to citizens of these three regions in 2023 will be approximately 790,000, an 11.5% increase over 2019. In the same year, the total number of students from China, India, the United Kingdom, France, and Germany, studying in US higher education institutions was 587,000, recovering to 98.9% in 2019.
Table 2 Number of the United States nonimmigrant work visas and professional immigrant visas granted to China, major European countries, and India
Table 3 Number of students from China, major European countries, and India studying in the United States
Second, after the COVID-19 Pandemic, India has rapidly emerged as the largest source of international talent for the United States. In 2023, the total number of Indian nationals granted US non-immigrant work visas and occupational immigrant visas soared to 489,000, a 50 per cent increase from 2019, 6.5 times that of China and 1.9 times that of Europe. In the same year, the number of Indian students studying in US universities also reached 269,000, which is 93% of the total number of Chinese students in the US, 9.3 times the total number of British, French and German students in the US, and the number of Indian students in the US increased by 39% compared to 2019.
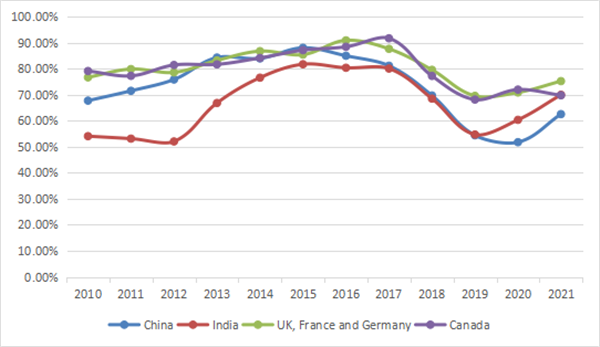
From the data of EB-1A Extraordinary Ability approval rate of different countries, there is a significant increase in the approval rate from 2012 to 2016, but each country has a significant decline between 2016-2020. As can be seen from the chart, major applicant countries such as China, India, England, France, Germany, and Canada all show this trend, which shows that the USCIS does not differentiate between a single country or region based on country ethnicity. The overall trend is still strongly related to USCIS adjudication standards.
Figure 36 The approval rate of applying EB-1A visa of different countries over the years (%)
Data Source: USCIS.
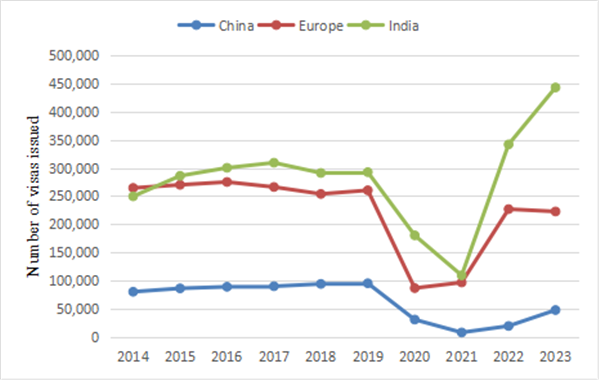
Fourth, the number of U.S. nonimmigrant work visas granted to citizens of China, Europe, and India were all significantly affected by the Covid-19 Pandemic, but India and Europe recovered much more quickly than China. The number of Chinese, European and Indian citizens obtaining U.S. nonimmigrant work visas basically showed a stable or slowly rising trend before the Pandemic, while during the Pandemic, they were all hit by a huge impact, reaching the lowest value in nearly a decade. After the Pandemic, the number of nonimmigrant work visas granted to citizens of Europe and India rebounded rapidly, with the total number of nonimmigrant work visas granted to European citizens to travel to the U.S. in 2022 and 2023 having recovered to about 220,000, or roughly 85 percent of the pre-epidemic level; and the number of nonimmigrant work visas granted to citizens of India reaching a new all-time high in 2023 at 442,421, or 1.5 times higher than the pre-epidemic level. Times. The number of Chinese citizens receiving nonimmigrant work visas recovers more slowly, with the total number of Chinese citizens receiving U.S. nonimmigrant work visas recovering to 48,338 in 2023, only half the number in 2019.
Figure 37 The number and trends of Chinese, European, and Indian citizens receiving U.S. nonimmigrant work visas, 2014-2023
Data Source: USCIS.
III. Trend of American Policies on Governance on the Flow of International Talents
(I)Attach long-term and great importance to the cultivation and introduction of talents in STEM disciplines upon cooperation among several authorities
The United States has been paying much attention to the cultivation of talents in core disciplines in the field of Science, Technology, Engineering, and Mathematics (STEM). The Undergraduate Education in Science, Mathematics, and Engineering issued by National Science and Technology Council in 1986 proposed the integration of “education in science, mathematics, engineering, and technology”, which marked the beginning of the construction of STEM discipline education system in the United States. In 2007, the United States Congress officially approved the National Action Plan, which specifically stipulated special funds on STEM discipline education and led to the incoming of the comprehensive development of STEM discipline education. In 2015, the Obama Administration issued the STEM Education Act, which officially included computer science in the STEM discipline to ensure the international competitiveness of the United States in artificial intelligence, quantum information, advanced communication, and other cutting-edge innovation fields. The Biden Administration has made comprehensive enhancement on the STEM talent competition and signed administrative orders to instruct the Department of State, Department of Justice, Department of Labor, Department of Health and Human Services, Department of Housing and Urban Development, Department of Education, Department of Homeland Security, and other authorities to issue multiple policies including Early Career STEM Research Initiative, STEM Discipline Update, O-1 Guidance, and Guidance on National Interest Waiver Immigration.
There is no doubt that the United States has outstanding performance in the cultivation and introduction of international talents in STEM fields. According to the latest report of the American Immigration Commission, a non-profit organization, which was issued in June 2022, as of 2019, the amount of foreign skilled immigrants accounted for 23.1% of the total amount of STEM workers in the United States, having significantly increased compared with the data in 2000, specifically 16.4%. Those with a master’s degree and doctor’s degrees accounted for 49.3% of total skilled immigrants in four categories, far beyond the data in local Americans with these degrees, 21.8%. Similarly, there were 1.075 million international students in the United States in the academic year of 2019-2020 and those majored in STEM accounted for 52%. Other data indicates that, in 2020, 46% of 34,000 students with a doctor’s degree in the science or engineering field issued by American education institutions were foreign students with temporary visas. One study of the World Bank Development Research Group shows that when the number of foreign postgraduates increases by 10%, the number of patent applications, university patent authorization, and non-university patent authorization in the United States will increase by 4.5%, 6.8%, and 5.0%, respectively. Thus, it can be seen that international talents in STEM fields have played an important role in the innovation and patent output of the United States.
In recent years, the Biden Administration has continuously increased fund investment in STEM talents. In the fiscal years of 2021 and 2022, total investment by the U.S. government in STEM education, which was up to USD3.922 billion and USD4.228 billion, respectively, showed significant growth compared with USD3.504 billion in the fiscal year of 2020. At the same time, the Federal Government has continually strengthened its support for major scientific research institutions. For instance, according to the “Consolidated Appropriations Act of 2022” of the United States Congress (Public Law 117-103), the appropriation of USD8.8 billion was provided to the U.S. National Science Foundation, showing an increase of USD351.2 million, or 4.1%, above the FY 2021 appropriation. In the meantime, according to the “Consolidated Appropriations Act of 2023” (Public Law 117-328), the appropriation of USD9.54 billion was provided to the U.S. National Science Foundation, an increase of USD701 million, or 7.9%, above the FY 2022 appropriation. And in the same year, the National Institutes of Health has created the highest rate of project funding in recent ten years, up to 30%.
(II) Continuously expand the STEM discipline fields and the introduction of international talents
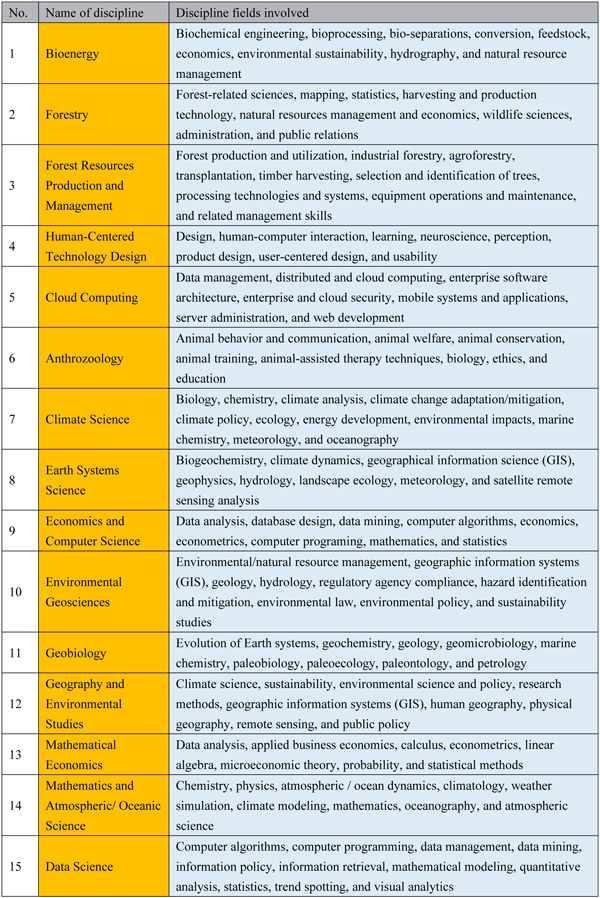
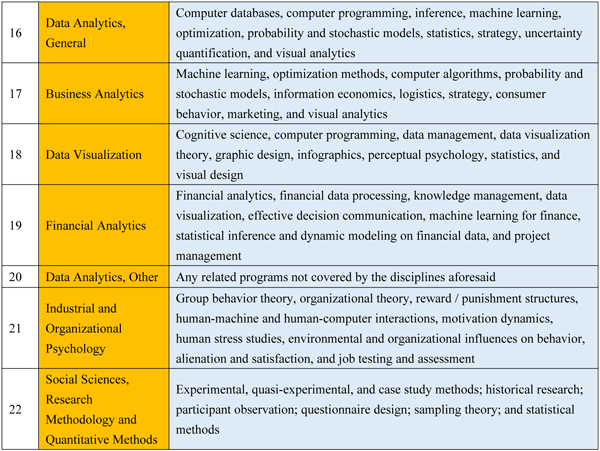
In January 2022, U.S. Immigration and Customs Enforcement and U.S. Department of Homeland Security officially issued the policy – Update to the STEM Designated Degree Program List, in which 22 new STEM disciplines, covering multiple disciplines of emerging technology and interdisciplinary disciplines, such as bioenergy, forestry, forest resource production and management, cloud computing, earth system science, climate science, data science, industrial and organizational psychology, and computational social science, were added. Accordingly, more students could enjoy preferential policies in STEM fields and the introduction of international talents could be greatly expanded.
Table 4 List of Newly-added STEM Education Disciplines in 2022
Data source: “Update to the Department of Homeland Security STEM Designated Degree Program List”, U.S. Immigration and Customs Enforcement and U.S. Department of Homeland Security.
(III) Reform the visa policy and lower the threshold for STEM talents to go to and stay in the United States
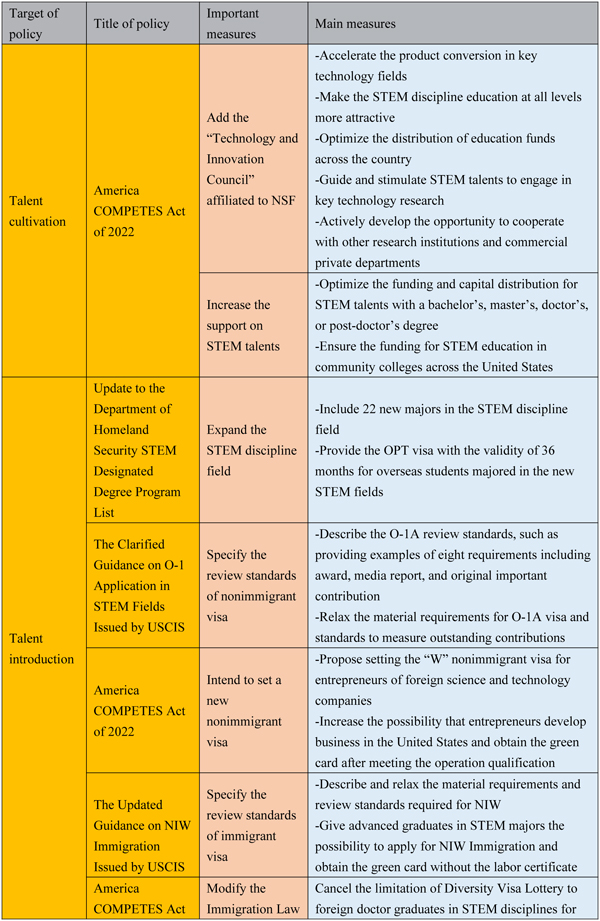
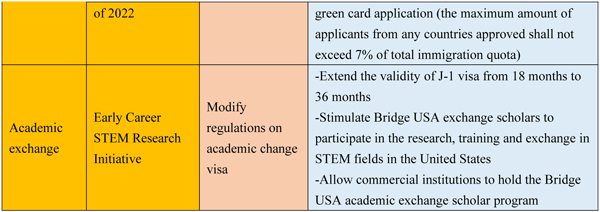
In recent years, the United States is steadily promoting the reform on the visa policy and lowering the threshold of visa approval. The duration of J-1 visa for academic communication has increased from 18 months to 36 months to share the pressure from considerable applicants of H-1B visa and accordingly provide alternative visa plans for STEM talents, making it more convenient for STEM talents to stay in the United States and seek employment. In the Guidance on O-1 Extraordinary Ability Visa issued by the USCIS, the standard to measure extraordinary talents in STEM fields has relaxed; to be specific, such two aspects as advanced degree and exceptional ability are considered for talent introduction; the Guidance on National Interest Waiver Immigration has been further improved and it is the first time that medical doctors in STEM disciplines are allowed to directly apply for the green card through the National Interest Waiver Program and are exempted from the 7% limitation of Diversity Visa Lottery, which has greatly shortened the application cycle of green card; previous review rules of O-1A visa which were limited to outstanding talents in science, business, education, and sports, become flexible, making them more applicable to special talents with “extraordinary ability” in STEM fields; the new “W” nonimmigrant visa for highly skilled talents of scientific and technological enterprises is set to provide great convenience for business talents in the science and technology field to develop business and stay in the United States.
Table 5 Main Measures Used in the United States for Improving the Global Competitiveness of STEM Talents
(IV)Actively promote communication and cooperation among international talents in STEM fields
In terms of communication and cooperation among international talents, the US-EU Trade and Technology Committee was established in June 2021 for coordination and cooperation between American and European experts in key fields. In May 2022, the United States and Japan implemented the Competitiveness and Resilience Partnership program and established a wireless network training institute in southeast Asian countries to train hi-tech talents for development of the program. In addition, on the Quadrilateral Security Dialogue Summit by and among the United States, Japan, India, and Australia, the Quadrilateral Scholarship was set to fund 100 students each year for completing the study of the master’s degree in STEM fields in the United States to further accelerate the interaction and cultivation of global scientific and technological talents.
IV. Overview of China’s international mobility of talent and governance recommendations
(I)The Overview of International Talent Mobility in China
1. International Immigration
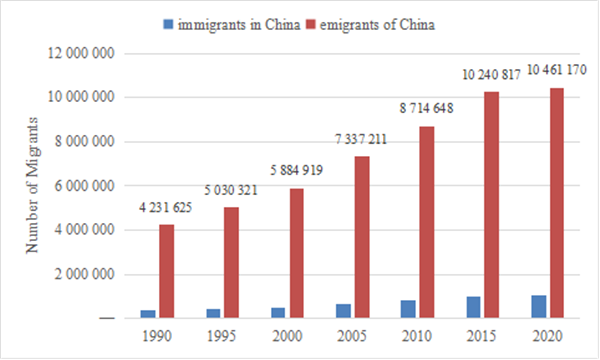
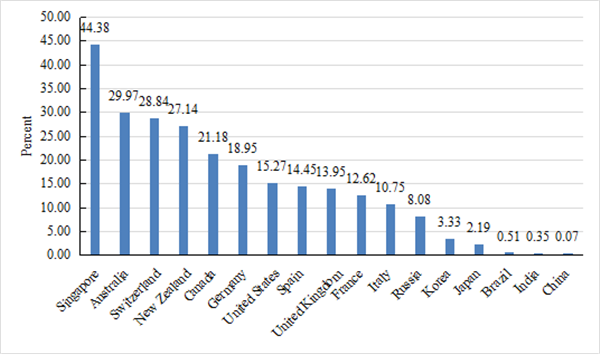
According to International Migrant Stock 2020, published by the United Nations Department of Economic and Social Affairs, by mid-2020, the number of emigrants of mainland China was about 10.46 million. At the same time, there were about 1.04 million immigrants in mainland China, accounting for about 10% of the total number of emigrants, accounting for 0.07% of the total population of the Chinese mainland, lower than Brazil (0.51%) and India (0.35%).
Figure 38 Number of Chinese Emigrants and immigrants in Chinese mainland
Data Source: United Nations.
Figure39 International migrants as a proportion of total population in world’s major countries
Data Source: World Bank.
China, which was the second largest recipient of remittances after India until 2021, has shifted from being the second largest remittance importer to the third largest remittance importer in 2022. At the same time, as an important source of international remittances, China exported a total of $18.26 billion in 2022. Although the amount is down from $23 billion in 2021, China has risen to the fifth largest source of overseas remittances in the world. The decrease in the amount of overseas Chinese remittances received by China and the increase in the amount and ranking of overseas Chinese remittances exported by China indirectly reflect that China is undergoing a gradual change from a traditional immigrant exporting country to a country that combines multiple roles of migrant source, transit, and destination.
Table 6 Chinese Mainland Receiving/Sending International Remittances and its Rank (2010-2022) (current USD billion)
Data Source: World Migration Report 2024.
According to the seventh National Census, 846,000 foreigners living in 31 provinces, autonomous regions, and municipalities of the Chinese mainland were registered in the census in November 2020, an increase of 252,000 from 594,000 in November 2010, or an increase of 42.4 percent. This growing trend is also reflected in the relevant data of the permanent residency. Specifically, in 2016, the Ministry of Public Security approved 1,576 foreigners to obtain permanent residency in China, compared with 7,356 in the ten years from 2004 to 2013. The rise in the number was even more significant in 2018, with 2,409 foreigners receiving permanent residence permits in China in the first half of 2018 alone, a 109 percent increase compared to the same period in the previous year, a figure that is even more than 1.5 times the number approved in the whole of 2016. It can be seen that China’s efforts to attract international talents are increasing, and it is gradually becoming an important destination for international talent mobility.
2. International Student Mobility
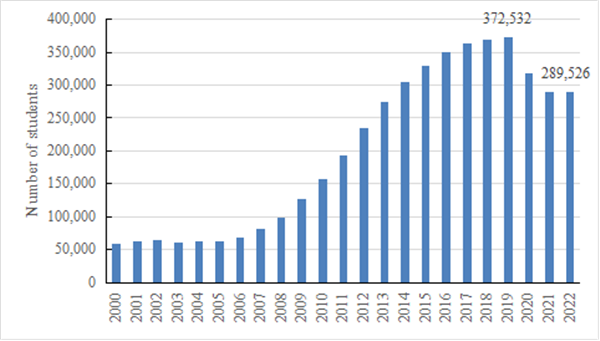
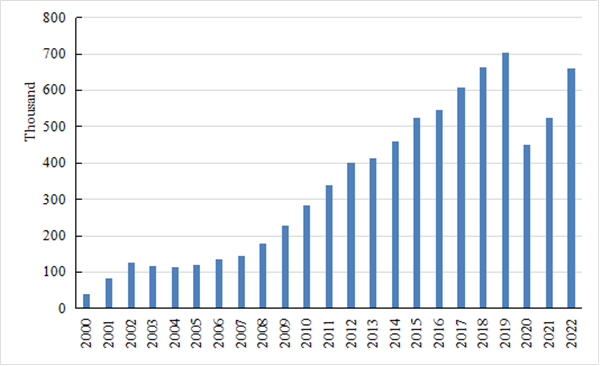
According to the latest UNESCO data, in 2021, China’s students studying at overseas higher education institutions reach 1.021 million, the highest number in the world and 3.6 percent less than in 2019. From 2000 to 2019, especially after the 2008 Beijing Olympics, the number of Chinese students studying abroad increased rapidly, and the development trend was basically the same as the general trend of China’s participation in the globalization process. According to the Ministry of Education, 703,500 Chinese studied abroad in 2019. Due to the COVID-19 epidemic and restrictions on visa issuance, the number of students studying abroad from 2020 to 2022 has decreased.
Figure 40 Changes in the number of Chinese students studying abroad, 2000-2022
Data Source: Organized according to the Ministry of Education and other public data, the data for 2020 and 2021 are from the speeches of the relevant leaders at the 20th Conference on International Exchange of Professionals, and the data for 2022 are from Internet information.
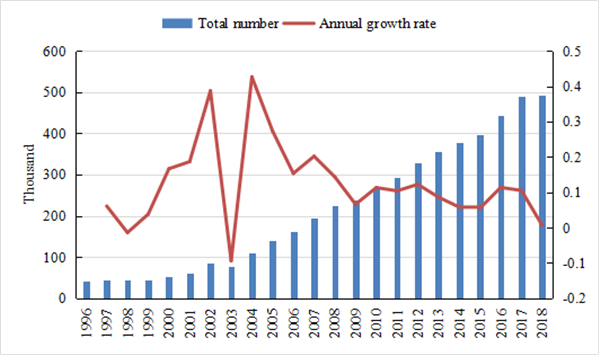
Consistent with the growth trajectory of the number of Chinese students studying abroad, the number of international students studying in China has also experienced significant growth over the past two decades. In 2000, the total number of international student registrations in China was 52,200, which increased to 492,200 in 2018, an 8.4-fold increase. Despite a clear long-term growth trend, the annual growth rate of international student numbers has shown a gradual slowdown since 2004. In 2018, the growth rate was only 0.62% compared with 2017, a figure well below the general annual growth rate of 1% to 7% for international students globally, indicating that the growth momentum of international students studying in China has weakened.
Figure 41 Total number and growth rate of international students in China
Data Source:1. The data from 1996 to 2007 are from Jiafu Cheng, A Historical Study on the Educational Structure of International Students in China (1950-2010) (in Chinese). Shanghai: Tongji University Press, 2012: 55.
- The data from 2008 to 2018 are from the Ministry of Education of China official website.
(II) Recommendations related to optimizing the governance of China’s international mobility of talent
1. Explore ways to establish and improve a skilled migration system
The National Medium- and Long-Term Plan for Human Resource Development (2010-2020) proposes to increase the introduction of foreign intelligence and to explore the implementation of skilled migration. Since the 18th National Congress of the Communist Party of China (CPC), the CPC and the State have attached great importance to the introduction of overseas talents; the level of services for the management of foreign talent projects has been continuously improved; the legal environment for the introduction of foreign talents has been continuously optimized; and significant progress has been made in reforming the foreign talent management system. In June 2016, China joined the International Organization for Migration (IOM) and officially became one of its member states. This is an inevitable choice for China to deepen its participation in global governance and international cooperation on migration. In March 2018, the National People’s Congress (NPC) passed the State Council Institutional Reform Program and formally established the National Immigration Administration, marking the formal entry of China’s immigration governance into a systematic development process. With the establishment of the National Immigration Administration and the continuous advancement of its governance practice, China’s immigration governance has entered a systematic and professional development track, and international immigration governance has become an important starting point for China to deeply participate in global governance and enhance its international influence. At the same time, the state and local governments are actively learning from international experience and exploring ways to attract overseas talents through the skilled immigration system. In February 2019, the Outline Development Plan for the Guangdong-Hong Kong-Macao Greater Bay Area proposed that the Guangdong-Hong Kong-Macao Greater Bay Area should be early and pilot implementations in areas such as skilled migration and put forward initiatives on skilled migration such as the “List System for Shortage of Talents” and the “Criteria for Recognizing Foreign High-level Talents”. In August 2020, the General Plan of China (Beijing) Pilot Free Trade Zone proposed to “pilot a quota management system for foreign talents”. In 2021, the Outline of the 14th Five-Year Plan (2021-25) for Economic and Social Development and Long-Range Objectives through the Year 2035 proposed to “explore ways to establish skilled migration system”. At the same year, Shenzhen’s Outline of 14th Five-Year Plan (2021-25) for Economic and Social Development and Long-Range Objectives through the Year 2035 proposed to “implement a more open and convenient system for the introduction and exit and entry administration of overseas talents, and explore the implementation of a skilled migration policies”. In that year, the Guangzhou Science and Technology Innovation Regulations came into force, and its Article 24 made it clear that “the Municipal People’s Government shall promote the construction of internationalized special zones for talents, and carry out the pilot project of skilled immigration”, which is the first time that skilled immigration entered the local laws and regulations. Under the dual background of promoting economic globalization and opening up to the outside world at a high level, the system of skilled immigration has become an important measure to “gather the world’s talents and make use of them” and deepen the reform of the system and mechanism of talent development in the new period, and it is also an important direction for the future development of China’s international migration governance.
To accelerate the construction of a world leader in science and technology and realize the strategic goal of high-level scientific and technological self-reliance and self-improvement, we need to “gather the world’s talents and make use of them”. China should increase the opening-up of its talents to the outside world and establish a sound and internationally competitive skilled immigration system in order to enhance the attraction and cohesion of the world’s talents. To explore the skilled immigration system, we should learn from the successful experience of the United States and other developed countries, give full play to the pillar role of the skilled immigration system in the introduction of foreign talents, embed the immigration system into the national strategies of opening up to the outside world at a high level, strengthening the country with talents, and coping with the aging of the population, so as to reshape the system of foreign talents in China.
To establish the skilled immigration system, the pace of the rule of law and digitization of skilled migration should be accelerated to achieve a series of important shifts, including: intelligent upgrading of the means of governance of skilled migration, and the further promotion of greater convenience and security in the areas of identification and document processing, customs clearance and government services; shifting the skills of foreign talents from subjective assessment to objective assessment; shifting the application for entry and exit and immigration documents of foreign talents from employers to skills; shifting the application for foreign talents from government-orientation to market-orientation; shifting the status of foreign talents from that of foreigners to that of Chinese nationals; shifting the introduction of foreign talents from piecemeal introduction to systematic introduction; shifting the prevention of immigration risks from a single subject to multiple subjects; shifting the management of immigration from centralized management to both centralized and localized management and from principled management to precision management.
2. Improve the whole-chain Management System for International Students
The strategy of attracting international students and retaining outstanding graduates is often referred to as a “profitable” approach for bringing in international talent. International students are more familiar with the country than directly imported foreign talents. Additionally, international students save on education costs relative to local talents. Even if these international talents are not ultimately retained by the country, they still contribute to educational foreign exchange earnings as they must leave upon visa expiration. Consequently, many countries view international students as a crucial means to enrich their talent pool, providing conditional scholarships and facilitating visas and immigration. Developed countries such as the United States, the United Kingdom, Australia, and Japan have recognized the importance of attracting international students to gather talents and have adjusted their policies accordingly to recruit international students.
In recent years, the level of higher education in China continues to rise, as does the scale of international students coming to China, making the country a significant destination for international education. Going forward, it is imperative to enhance efforts to promote the role of international study in attracting and utilizing foreign talent. This could involve: First is to abandon the passive mindset of “sitting, waiting, and relying on others to take the initiative” and to adopt more proactive admission strategies. Second, establish a comprehensive evaluation system covering the whole process from admission to employment for international students and adjust admission and cultivation strategies based on the evaluation results. Third, grant higher education institutions a certain degree of autonomy in determining tuition fees for international students, motivate them to improve the quality of education and set up internationalized interdisciplinary courses. Fourth, introduce more flexible and clear policies for international students’ internships, employment, and entrepreneurship. This includes exploring the granting of internship visas to outstanding STEM students and talent visas to excellent STEM graduates, and establishing a policy coordination mechanism to leverage the role of international students, creating a seamless loop for selecting global talent suitable for China’s development from among outstanding international students.
3. Foster a more inclusive vision of governance
The cross-border flow of talents has introduced diversified elements into the economic and social development of countries around the world, implanted strong innovation momentum for scientific and technological progress, and prompted countries to compete for outstanding immigrant talents and international students. In the new stage of globalization, further promoting the flow of talents, especially the continuous exchanges of immigrant talents and international students, is of great significance in reducing misunderstandings, promoting people-to-people exchanges, expanding cooperation and consensus, and promoting high-quality development.
As China continues to deepen its high-level opening-up to the outside world and enjoys rapid economic and social growth, the flow of people between China and the rest of the world is getting closer and closer, and China is undergoing a transformation from being a single source of migrants to playing multiple roles as a source, transit and destination country. This makes the governance of international migration an important issue for China’s participation in global governance. As the world’s largest developing country, China has always been the focus of international and domestic attention with regard to the introduction of international talent, especially international migrants. However, China’s migration management system is still in the development stage, and the public’s understanding of the concept of migration is often ambiguous, and this cognitive bias has led to a deviation in the social understanding of the migration issue, which has indirectly inhibited China’s pace of attracting international talents through the skilled migration system. In view of this, there is an urgent need to strengthen the social popularization of the concept of immigration and positive public opinion orientation, to encourage an open and tolerant, fair and just mindset in examining the issue of immigration, and to fully recognize the role of immigrants as a bridge to promote the economic prosperity, social progress and cultural exchanges of all countries, so as to create a positive and friendly social atmosphere for the healthy development of China’s immigration governance system.
4. Strengthen exchanges and cooperation with international organizations
Talent mobility is a complex phenomenon that transcends national, sectoral and individual boundaries, and its governance is relatively complicated, requiring the strengthening of international cooperation and the active promotion of cooperation and exchanges with international organizations. First, high-level migration dialogues and exchanges should be promoted in order to accelerate the synergistic development of international skilled migration governance. The role of global platforms such as the International Organization for Migration (IOM) and the Organization for Economic Development Cooperation (OEDC) should be brought into full play to deepen dialogue and cooperation with neighboring countries and the world’s major countries on migration governance and migrant integration strategies, and to participate in the construction of a new international migration order and propose solutions with Chinese characteristics. Second, deepen cooperation with international professional organizations in the fields of skilled migration and talent mobility, and expand the breadth and depth of cooperation. In particular, in the areas of academic accreditation, vocational qualifications and skills assessment, international professional resources should be utilized to enhance the influence in the setting of norms for the international flow of talent. Thirdly, continue to organize the Global Talent Mobility and Governance Forum, establish a global cooperation and dialogue mechanism, and build bridges for international talent exchanges. This will promote an atmosphere of common consultation and sharing, facilitate the formation of a global consensus on talent development and exchange, enhance the fairness, synergy and inclusiveness of talent mobility, and lay a solid foundation for harmonious interaction and win-win situations for global talent.
5. Encourage social forces to participate in the co-governance of immigration
With the continuous growth of international migrants in China, the task of social governance has become increasingly complex, and it is obviously not possible to rely on government departments alone to carry out immigration management and services. Therefore, it is particularly critical to build a diversified governance system led by the government and united with relevant stakeholders of immigration (including immigration intermediary agencies, grassroots communities, international medical service system, international educational institutions, etc.) to promote the transformation of immigration governance to a comprehensive, cross-disciplinary, deep-level and professional direction. For example, Shanghai has set a precedent by setting up the first one-stop service centre for permanent residence affairs, which integrates multiple immigration management and service departments such as human resources, foreign expert affairs, overseas Chinese affairs, taxation, entry-exit inspection and quarantine, and notarization, and sets up a comprehensive service window to provide one-stop government consultation services. At the same time, the service centre also works with social service agencies as an auxiliary service port to provide multi-faceted professional consultation and services for resident foreigners, such as language training, medical treatment, schooling, rental, car purchase, and legal aid, to further enhance the convenience and professionalism of services.
At the same time, we should give full play to the role of grass-roots social organizations and institutions, open up channels for international migrants to participate in community governance, so as to enhance their sense of belonging and social participation, and promote the integration of immigrants into society. Yiwu’s “ management of foreigners by foreigners ” model is a courageous attempt to help foreigners quickly integrate into local life by hiring foreign mediators to resolve foreign-related disputes, bringing in professional social workers in residential areas where foreigners are concentrated, and conducting activities such as language training and cultural adaptation education. In view of the diversity of migration governance needs and situations in various regions, local governments should adapt to local conditions, flexibly integrate resources, innovate the international migration governance model, improve the accuracy of governance, and ensure efficient coordination of resources, and jointly promote the formation of a new pattern of international migration governance with the participation of multiple entities.
6. Pilot a more open visa policy
At present, China has achieved unprecedented breakthroughs in visa facilitation. The implementation of a more convenient and open visa policy is an important measure to promote multicultural exchanges and accelerate economic and social development. It will not only strongly promote the construction of a new type of international relations featuring openness, inclusiveness, mutual benefit and win-win results, but also demonstrate China’s open mind and modern governance capacity, laying a solid foundation for attracting more international talents, international capital injection and innovative resource exchanges.
Further reform of China’s visa policy could follow two main directions. First, deepen visa facilitation reform based on the existing policy framework. According to the results of the evaluation of the effectiveness of the current unilateral visa-free policy, the scope of unilateral visa-free countries should be further expanded, especially those countries with frequent economic interactions and close people-to-people exchanges, such as Japan, South Korea, the United States, the United Kingdom and Australia, and trial unilateral visa-free treatment should be considered for specific groups such as youth exchanges and business visits. The second is to improve the electronic level of visa to China and establish a fully functional electronic visa application platform. On the basis of the existing visa application centre platform, combine advanced electronic information technology and AI technology to create an integrated online service platform for China’s electronic visa. The platform will guide foreigners to apply for visas to China online through the entire process of, realizing a modernized visa application process of online filling, data uploading, online payment and visa receiving, so as to simplify the conventional process, reduce service costs and improve service efficiency.
7. Create a more international living environment
The main problems encountered by international talents living in China include the inconvenience of mobile payment and network access.
In terms of mobile payment, at present, the three main payment methods for foreigners in China include card payment, cash and mobile payment, and many foreign talents have difficulties and obstacles in using all three payment methods. Despite the extreme popularity of mobile payments in China, foreigners may find that their international credit cards do not work in some places or have difficulty binding and using local payment apps. In March 2024, The General Office of the State Council issued the Opinions on Further Optimizing Payment Services and Improving the Convenience of Payment, emphasizing that mobile payment, bank cards, cash and other payment methods should develop in parallel and complement each other, which could further improve the level of payment services, and promote a high level of opening-up. In order to facilitate card payment and mobile payment by foreigners, efforts can be made to solve the payment problems of foreigners by appropriately installing additional POS machines, lowering card payment rates, opening payment service desks at airports and other first stops for foreigners coming to China, and providing services such as currency exchange, mobile payment application downloads and guidance on the use of such services.
In terms of network access, although foreigners can currently use VPNs to access foreign websites, there are still problems with the small scope of use and high roaming costs. At present, there are mature solutions for accessing foreign websites around the country. For example, during the Beijing Winter Olympics, China provided solutions to facilitate foreigners’ Internet access; During the Asian Games in Hangzhou, the city opened VPNs for foreign athletes for a limited time. At present, employees of international enterprises or foreign trade enterprises in China can access foreign websites through VPN for work proposes. However, on the whole, the radius of these Internet access facilities is still relatively small, it is recommended to extend the current effective initiatives to facilitate foreigners’ access to the Internet to a wider range of foreign nationals in China, so as to provide foreigners with more convenient and more affordable network communication services.
References
- Wissenschaft weltoffen kompakt 2024. [EB/OL].[2024-05-14]https://www.wissenschaft-weltoffen.de/en/. Accessed May 14, 2024.
- DHS Office of Immigration Statistics. 2022 Yearbook of Immigration Statistics. [EB/OL].[2024-05-14]. https://www.dhs.gov/sites/default/files/2024-02/2023_0818_plcy_yearbook_immigration_statistics_fy2022.pdf.
- https://ec.europa.eu/eurostat/web/interactive-publications/migration-2023#migrant-skills.
- Open Doors 2023.[2024-05-14] https://opendoorsdata.org/fast_facts/fast-facts-2023/
- ILO Global Estimates on International Migrant Workers Results and Methodology, 2021.
- World Migration Report 2024. https://publications.iom.int/books/world-migration-report-2024..
- OECD Library. Germany. [EB/OL].[2024-05-14].https://www.oecd-ilibrary.org/sites/214b39be-en/index.html?itemId=/content/component/214b39be-en.
- 战争和暴力导致全球流离失所人数上升至约1.14 亿. [EB/OL].(2024-02-06)[2024-05-12]. https://www.unhcr.org/cn/18219-战争和暴力导致全球流离失所人数上升至约1-14-亿.html.
- WTO: Evolution of trade under the WTO: handy statistics.[EB/OL]. [2024-05-14]. https://www.wto.org/english/res_e/statis_e/trade_evolution_e/evolution_trade_wto_e.htm.
- 高子平:《外籍人才移民制度研究》,上海.上海财经大学出版社,2023年版,第83-84页.
- 公安部:出入境新政有力服务国家发展大局. [EB/OL].(2017-02-06)[2024-05-12].https://www.gov.cn/xinwen/2017-02/06/content_5165608.htm.
- 广州人大. 广州市科技创新条例. [EB/OL].(2021-06-15)[2024-05-12]. http://kjj.gz.gov.cn/xxgk/zcfg/zcfgwj/content/post_7333148.html.
- 国家统计局. 2010年第六次全国人口普查接受普查登记的港澳台居民和外籍人员主要数据. [EB/OL].(2011-04-29)[2024-05-12]. https://www.stats.gov.cn/sj/zxfb/202303/t20230301_1919257.html.
- 国家统计局. 第七次全国人口普查公报. [EB/OL].(2021-05-11)[2024-05-12]. https://www.gov.cn/guoqing/2021-05/13/content_5606149.htm.
- 环球网. 美国结束禁令向国际游客重开边境,美媒着急提醒:欧洲正处于新冠疫情“中心”. [EB/OL]. https://baijiahao.baidu.com/s?id=1715944905447603054&wfr=spider&for=pc.
- 联合国. 变革我们的世界:2030年可持续发展议程. [EB/OL]. (2016-04-13)[2024-05-12]. https://sustainabledevelopment.un.org/content/documents/94632030%20Agenda_Revised%20Chinese%20translation.pdf.
- 刘国福.探索建立技术移民制度——兼论重塑我国外国人才制度[J].人民论坛学术前沿,2023,(16):96-103.
- 人民日报. 上半年全国出入境人员总数同比增7%. [EB/OL].(2018-07-19)[2024-05-12].https://www.gov.cn/xinwen/2018-07/19/content_5307583.htm.
- 深圳市人民政府. 深圳市国民经济和社会发展第十四个五年规划和二〇三五年远景目标纲要. [EB/OL].(2021-06-09)[2024-05-12]. https://www.sz.gov.cn/cn/xxgk/zfxxgj/ghjh/content/post_8854038.html.
- 王辉耀, 苗绿. 中国国际移民报告[M]. 北京:社会科学文献出版社. 2020.
- 王辉耀, 苗绿. 国家移民局[M]. 北京:中国社会科学出版社. 2018.
- 王辉耀, 苗绿, 郑金连. 国际人才学概论[M]. 北京:中国人事出版社. 2020.
- 王辉耀, 苗绿, 郑金连. 中国留学发展报告(2022)[M]. 北京: 社会科学文献出版社. 2022.
- 外交部. 中国加入国际移民组织. [EB/OL].(2016-06-30)[2024-05-12] https://www.fmprc.gov.cn/zwbd_673032/wshd_673034/201607/t20160701_5788988.shtml.
- 新华社. 国家中长期人才发展规划纲要(2010-2020年)发布. [EB/OL].(2010-06-06)[2024-05-12] https://www.gov.cn/jrzg/2010-06/06/content_1621777.htm.
- 新华社. 中共中央国务院印发《粤港澳大湾区发展规划纲要》. [EB/OL]. (2019-02-18)[2024-05-12]. https://www.gov.cn/zhengce/2019-02/18/content_5366593.htm#1.
- 新华社. 中华人民共和国国民经济和社会发展第十四个五年规划和2035年远景目标纲要. [EB/OL].(2021-03-13)[2024-05-12]. https://www.gov.cn/xinwen/2021-03/13/content_5592681.htm.
- 印度自2021年6月7日起便开始了大规模的解封,部分邦放宽了大部分防疫限制。(资料来源:华夏时报:https://baijiahao.baidu.com/s?id=1701957569152989572&wfr=spider&for=pc)。
- 袁春生、刘海丹. 《着力把云南打造成为区域性国际人才高地》. [EB/OL].(2022-03-01) [2024-05-14]. http://www.sky.yn.gov.cn/xsyj/zgsd/6707659587277379579.
- 中国青年网. 欧洲多国开始“解封”. https://baijiahao.baidu.com/s?id=1698816142312625410&wfr=spider&for=pc.
About Alliance of Global Talent Organization(AGTO)
AGTO is a non-governmental organization initiated by Center for China and Globalization (CCG). It is committed to bring relevant stakeholders together with the aim to enhance the governance of global talent mobility worldwide. It was successfully selected as part of the inaugural Paris Peace Forum from among thousands of global governance project applications worldwide and officially launched at the third edition Paris Peace Forum in 2020.
About Center for China and Globalization(CCG)
The Center for China and Globalization (CCG) is a leading international social think tank in China. It was established in 2008 and is the first Chinese think tank to obtain consultative status with the United Nations. CCG is also the first Chinese social think tank to enter the list of top 100 think tanks worldwide. It has been consistently ranked as the top social think tank in China by various authoritative rankings both domestically and internationally.
CCG has been granted the status of a postdoctoral research workstation by the Ministry of Human Resources and Social Security, and it has the qualification to independently recruit postdoctoral researchers. CCG serves as the National Talent Theory Research Base of the Coordination Group for Central Talent Work. CCG is the location of the International Talent Professional Committee of the China Talent Research Association under the Ministry of Human Resources and Social Security. It is also a founding member of the US Research Think Tank Alliance initiated by the Ministry of Finance. CCG serves as the Vice President Unit of the China Public Relations Association and is the Secretariat of the Global Young Leaders Dialogue (GYLD) project. In 2021, the GYLD project initiated by CCG received a reply from President Xi Jinping.
Website: http://en.ccg.org.cn/
Research Team Advisor:
Wang Huiyao, AGTO Director-General, CCG President, Professor, Doctoral Supervisor
Research Team:
Miao Lv, AGTO Secretary-General, CCG Secretary-General, Senior Fellow
Zheng Jinlian, CCG Vice President, Head of Research, Senior Fellow
Liu Guofu, CCG Distinguished Senior Fellow, Professor at Beijing Institute of Technology
Zhang Wei, CCG Deputy Secretary-General, Senior Fellow
Zhao Zhanjie, CCG Deputy Director of External Cooperation, GYLD Project Manager
He Hangyu, CCG Assistant Research Fellow
Guo Tengda, CGG Research Assistant
Li Haokai, CGG Research Assistant
About Yingzhong Overseas Consulting
Yingzhong Overseas Consulting is a professional consulting firm specializing in due diligence, individual visa applications, immigration procedures, and foreign business and legal services for U.S. and Chinese companies. The company has set up a law firm in the United States, and has service agencies and independent copywriting centers in Beijing, Shanghai, Shenzhen, and Tianjin, China. It provides comprehensive solutions including professional consulting, copywriting, project planning and legal services to Chinese financial service institutions, immigration companies, and family offices; forming a full-chain closed-loop service model from consultation to implementation. Currently, we are proud to be the exclusive China consulting partner for international law firm Butzel Long, a founding member of Lex Mundi, the world’s largest international law organization.
Yingzhong Overseas Consulting’s commitment to professionalism and insights in the field of international migration, talent mobility and overseas Chinese, has garnered an industry reputation as a trusted source of information for many international authoritative media, such as Singapore’s South China Morning Post, AFP, and the Netherlands’ Telegraph. These media organizations frequently seek professional knowledge and analysis from Yingzhong Overseas Consulting on the latest trends and conditions in international migration policies and cross-border talent mobility, and cite company experts and forecasts in their reporting.
Research Team:
Shize Guo: Senior Council Member Center for China and Globalization Think Tank (CCG), CEO of Yingzhong Overseas Consulting, Founding Partner at Yingzhong Law Offices, P.C.
Liu Jinwen: Managing Partner of Yingzhong Law Offices,P.C., member of AILA Immigration Lawyers Association
Todd Jackson: Director of U.S. Affairs and Public Policy at Yingzhong Overseas Consulting
Sun Yu: Director at Yingzhong Overseas Consulting
Zhang Chenguang: Senior Researcher at Yingzhong Overseas Consulting
Website: https://www.ingzhong.com/
